
 Yahoo Finance
 The Returns At United Utilities Group (LON:UU.) Aren't Growing
Did you know there are some financial metrics that can provide clues of a potential multi-bagger? Amongst other things, we'll want to see two things; firstly, a growing return on capital employed (ROCE) and secondly, an expansion in the company's amount of capital employed. Put simply, these types of businesses are compounding machines, meaning they are continually reinvesting their earnings at ever-higher rates of return. Having said that, from a first glance at United Utilities Group (LON:UU.) we aren't jumping out of our chairs at how returns are trending, but let's have a deeper look.
Understanding Return On Capital Employed (ROCE)
Just to clarify if you're unsure, ROCE is a metric for evaluating how much pre-tax income (in percentage terms) a company earns on the capital invested in its business. The formula for this calculation on United Utilities Group is:
Return on Capital Employed = Earnings Before Interest and Tax (EBIT) ÷ (Total Assets - Current Liabilities)
0.047 = UK£623m ÷ (UK£14b - UK£996m) (Based on the trailing twelve months to March 2021).
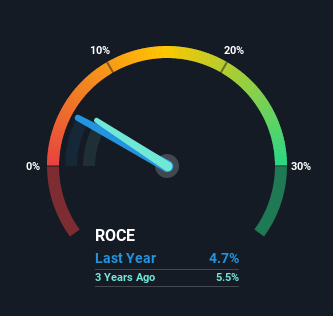
Thus, United Utilities Group has an ROCE of 4.7%. Even though it's in line with the industry average of 4.7%, it's still a low return by itself.
View our latest analysis for United Utilities Group
Above you can see how the current ROCE for United Utilities Group compares to its prior returns on capital, but there's only so much you can tell from the past. If you're interested, you can view the analysts predictions in our free report on analyst forecasts for the company.
What Does the ROCE Trend For United Utilities Group Tell Us?
There hasn't been much to report for United Utilities Group's returns and its level of capital employed because both metrics have been steady for the past five years. It's not uncommon to see this when looking at a mature and stable business that isn't re-investing its earnings because it has likely passed that phase of the business cycle. So unless we see a substantial change at United Utilities Group in terms of ROCE and additional investments being made, we wouldn't hold our breath on it being a multi-bagger. On top of that you'll notice that United Utilities Group has been paying out a large portion (91%) of earnings in the form of dividends to shareholders. If the company is in fact lacking growth opportunities, that's one of the viable alternatives for the money.
What We Can Learn From United Utilities Group's ROCE
In a nutshell, United Utilities Group has been trudging along with the same returns from the same amount of capital over the last five years. And investors may be recognizing these trends since the stock has only returned a total of 35% to shareholders over the last five years. So if you're looking for a multi-bagger, the underlying trends indicate you may have better chances elsewhere.
On a final note, we found 4 warning signs for United Utilities Group (2 are a bit unpleasant) you should be aware of.
While United Utilities Group may not currently earn the highest returns, we've compiled a list of companies that currently earn more than 25% return on equity. Check out this free list here.
This article by Simply Wall St is general in nature. It does not constitute a recommendation to buy or sell any stock, and does not take account of your objectives, or your financial situation. We aim to bring you long-term focused analysis driven by fundamental data. Note that our analysis may not factor in the latest price-sensitive company announcements or qualitative material. Simply Wall St has no position in any stocks mentioned.
Have feedback on this article? Concerned about the content? Get in touch with us directly. Alternatively, email editorial-team (at) simplywallst.com.
