
 Yahoo Finance
 Returns At Weis Markets (NYSE:WMK) Appear To Be Weighed Down
If we want to find a stock that could multiply over the long term, what are the underlying trends we should look for? In a perfect world, we'd like to see a company investing more capital into its business and ideally the returns earned from that capital are also increasing. Ultimately, this demonstrates that it's a business that is reinvesting profits at increasing rates of return. Having said that, from a first glance at Weis Markets (NYSE:WMK) we aren't jumping out of our chairs at how returns are trending, but let's have a deeper look.
Return On Capital Employed (ROCE): What Is It?
For those that aren't sure what ROCE is, it measures the amount of pre-tax profits a company can generate from the capital employed in its business. The formula for this calculation on Weis Markets is:
Return on Capital Employed = Earnings Before Interest and Tax (EBIT) ÷ (Total Assets - Current Liabilities)
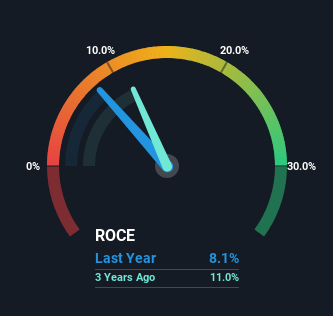
0.081 = US$137m ÷ (US$2.0b - US$341m) (Based on the trailing twelve months to December 2023).
Therefore, Weis Markets has an ROCE of 8.1%. Ultimately, that's a low return and it under-performs the Consumer Retailing industry average of 12%.
View our latest analysis for Weis Markets
While the past is not representative of the future, it can be helpful to know how a company has performed historically, which is why we have this chart above. If you want to delve into the historical earnings , check out these free graphs detailing revenue and cash flow performance of Weis Markets.
What The Trend Of ROCE Can Tell Us
There are better returns on capital out there than what we're seeing at Weis Markets. Over the past five years, ROCE has remained relatively flat at around 8.1% and the business has deployed 46% more capital into its operations. Given the company has increased the amount of capital employed, it appears the investments that have been made simply don't provide a high return on capital.
What We Can Learn From Weis Markets' ROCE
In conclusion, Weis Markets has been investing more capital into the business, but returns on that capital haven't increased. Since the stock has gained an impressive 67% over the last five years, investors must think there's better things to come. However, unless these underlying trends turn more positive, we wouldn't get our hopes up too high.
If you're still interested in Weis Markets it's worth checking out our FREE intrinsic value approximation for WMK to see if it's trading at an attractive price in other respects.
While Weis Markets isn't earning the highest return, check out this free list of companies that are earning high returns on equity with solid balance sheets.
Have feedback on this article? Concerned about the content? Get in touch with us directly. Alternatively, email editorial-team (at) simplywallst.com.
This article by Simply Wall St is general in nature. We provide commentary based on historical data and analyst forecasts only using an unbiased methodology and our articles are not intended to be financial advice. It does not constitute a recommendation to buy or sell any stock, and does not take account of your objectives, or your financial situation. We aim to bring you long-term focused analysis driven by fundamental data. Note that our analysis may not factor in the latest price-sensitive company announcements or qualitative material. Simply Wall St has no position in any stocks mentioned.
