
 Yahoo Finance
 Is REV Group, Inc.'s (NYSE:REVG) Recent Performance Tethered To Its Attractive Financial Prospects?
REV Group's (NYSE:REVG) stock is up by 7.3% over the past three months. Given its impressive performance, we decided to study the company's key financial indicators as a company's long-term fundamentals usually dictate market outcomes. In this article, we decided to focus on REV Group's ROE.
Return on equity or ROE is a key measure used to assess how efficiently a company's management is utilizing the company's capital. In short, ROE shows the profit each dollar generates with respect to its shareholder investments.
Check out our latest analysis for REV Group
How Is ROE Calculated?
The formula for return on equity is:
Return on Equity = Net Profit (from continuing operations) ÷ Shareholders' Equity
So, based on the above formula, the ROE for REV Group is:
64% = US$243m ÷ US$380m (Based on the trailing twelve months to April 2024).
The 'return' is the yearly profit. So, this means that for every $1 of its shareholder's investments, the company generates a profit of $0.64.
What Is The Relationship Between ROE And Earnings Growth?
So far, we've learned that ROE is a measure of a company's profitability. We now need to evaluate how much profit the company reinvests or "retains" for future growth which then gives us an idea about the growth potential of the company. Generally speaking, other things being equal, firms with a high return on equity and profit retention, have a higher growth rate than firms that don’t share these attributes.
A Side By Side comparison of REV Group's Earnings Growth And 64% ROE
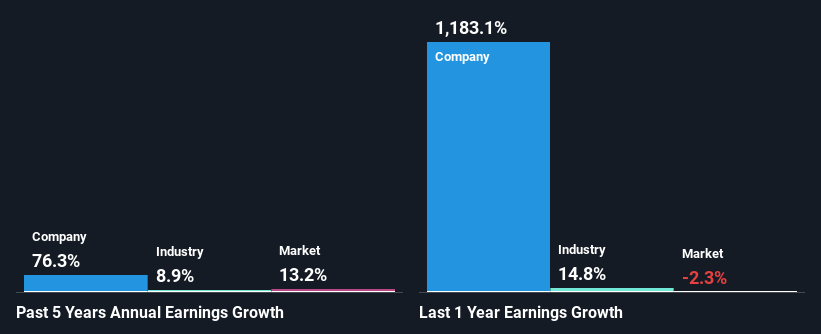
To begin with, REV Group has a pretty high ROE which is interesting. Additionally, the company's ROE is higher compared to the industry average of 14% which is quite remarkable. Under the circumstances, REV Group's considerable five year net income growth of 76% was to be expected.
We then compared REV Group's net income growth with the industry and we're pleased to see that the company's growth figure is higher when compared with the industry which has a growth rate of 8.9% in the same 5-year period.
The basis for attaching value to a company is, to a great extent, tied to its earnings growth. The investor should try to establish if the expected growth or decline in earnings, whichever the case may be, is priced in. This then helps them determine if the stock is placed for a bright or bleak future. If you're wondering about REV Group's's valuation, check out this gauge of its price-to-earnings ratio, as compared to its industry.
Is REV Group Using Its Retained Earnings Effectively?
REV Group's three-year median payout ratio is a pretty moderate 47%, meaning the company retains 53% of its income. By the looks of it, the dividend is well covered and REV Group is reinvesting its profits efficiently as evidenced by its exceptional growth which we discussed above.
Additionally, REV Group has paid dividends over a period of seven years which means that the company is pretty serious about sharing its profits with shareholders. Our latest analyst data shows that the future payout ratio of the company is expected to drop to 8.9% over the next three years. Regardless, the future ROE for REV Group is predicted to decline to 20% despite the anticipated decrease in the payout ratio. We reckon that there could probably be other factors that could be driving the forseen decline in the company's ROE.
Summary
In total, we are pretty happy with REV Group's performance. Particularly, we like that the company is reinvesting heavily into its business, and at a high rate of return. Unsurprisingly, this has led to an impressive earnings growth. That being so, according to the latest industry analyst forecasts, the company's earnings are expected to shrink in the future. To know more about the company's future earnings growth forecasts take a look at this free report on analyst forecasts for the company to find out more.
Have feedback on this article? Concerned about the content? Get in touch with us directly. Alternatively, email editorial-team (at) simplywallst.com.
This article by Simply Wall St is general in nature. We provide commentary based on historical data and analyst forecasts only using an unbiased methodology and our articles are not intended to be financial advice. It does not constitute a recommendation to buy or sell any stock, and does not take account of your objectives, or your financial situation. We aim to bring you long-term focused analysis driven by fundamental data. Note that our analysis may not factor in the latest price-sensitive company announcements or qualitative material. Simply Wall St has no position in any stocks mentioned.
Have feedback on this article? Concerned about the content? Get in touch with us directly. Alternatively, email editorial-team@simplywallst.com
