
 Yahoo Finance
 Revenues Not Telling The Story For Formycon AG (ETR:FYB)
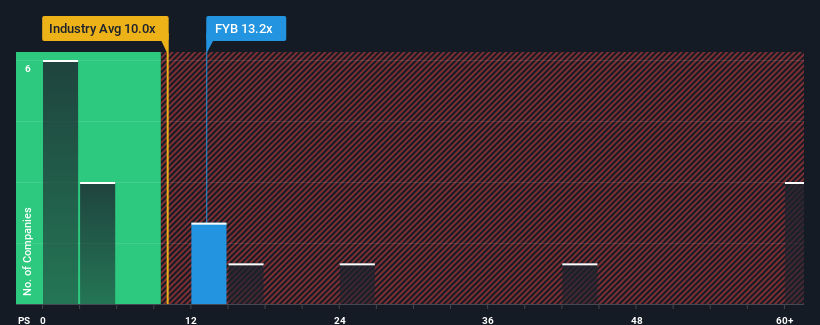
Formycon AG's (ETR:FYB) price-to-sales (or "P/S") ratio of 13.2x might make it look like a strong sell right now compared to the Biotechs industry in Germany, where around half of the companies have P/S ratios below 4.8x and even P/S below 1.5x are quite common. Although, it's not wise to just take the P/S at face value as there may be an explanation why it's so lofty.
Check out our latest analysis for Formycon
What Does Formycon's Recent Performance Look Like?
Recent times have been advantageous for Formycon as its revenues have been rising faster than most other companies. It seems the market expects this form will continue into the future, hence the elevated P/S ratio. If not, then existing shareholders might be a little nervous about the viability of the share price.
Want the full picture on analyst estimates for the company? Then our free report on Formycon will help you uncover what's on the horizon.
Do Revenue Forecasts Match The High P/S Ratio?
The only time you'd be truly comfortable seeing a P/S as steep as Formycon's is when the company's growth is on track to outshine the industry decidedly.
Retrospectively, the last year delivered an exceptional 101% gain to the company's top line. Pleasingly, revenue has also lifted 112% in aggregate from three years ago, thanks to the last 12 months of growth. So we can start by confirming that the company has done a great job of growing revenue over that time.
Turning to the outlook, the next three years should generate growth of 16% per annum as estimated by the five analysts watching the company. Meanwhile, the rest of the industry is forecast to expand by 17% per year, which is not materially different.
In light of this, it's curious that Formycon's P/S sits above the majority of other companies. Apparently many investors in the company are more bullish than analysts indicate and aren't willing to let go of their stock right now. These shareholders may be setting themselves up for disappointment if the P/S falls to levels more in line with the growth outlook.
The Bottom Line On Formycon's P/S
We'd say the price-to-sales ratio's power isn't primarily as a valuation instrument but rather to gauge current investor sentiment and future expectations.
Analysts are forecasting Formycon's revenues to only grow on par with the rest of the industry, which has lead to the high P/S ratio being unexpected. Right now we are uncomfortable with the relatively high share price as the predicted future revenues aren't likely to support such positive sentiment for long. A positive change is needed in order to justify the current price-to-sales ratio.
You always need to take note of risks, for example - Formycon has 1 warning sign we think you should be aware of.
It's important to make sure you look for a great company, not just the first idea you come across. So if growing profitability aligns with your idea of a great company, take a peek at this free list of interesting companies with strong recent earnings growth (and a low P/E).
Have feedback on this article? Concerned about the content? Get in touch with us directly. Alternatively, email editorial-team (at) simplywallst.com.
This article by Simply Wall St is general in nature. We provide commentary based on historical data and analyst forecasts only using an unbiased methodology and our articles are not intended to be financial advice. It does not constitute a recommendation to buy or sell any stock, and does not take account of your objectives, or your financial situation. We aim to bring you long-term focused analysis driven by fundamental data. Note that our analysis may not factor in the latest price-sensitive company announcements or qualitative material. Simply Wall St has no position in any stocks mentioned.
