
 Yahoo Finance
 Revenues Not Telling The Story For MedNation AG (FRA:EIF)
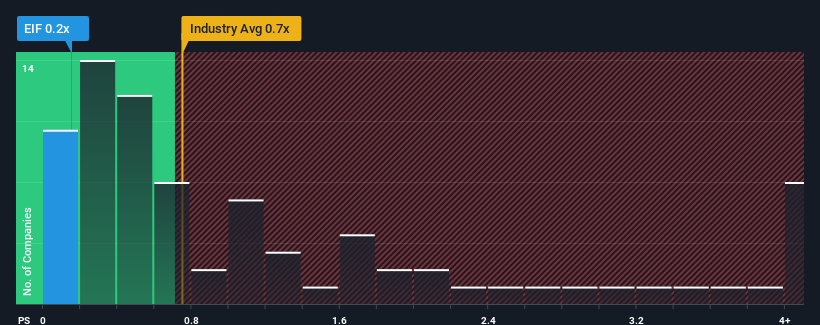
With a median price-to-sales (or "P/S") ratio of close to 0.5x in the Healthcare industry in Germany, you could be forgiven for feeling indifferent about MedNation AG's (FRA:EIF) P/S ratio of 0.2x. Although, it's not wise to simply ignore the P/S without explanation as investors may be disregarding a distinct opportunity or a costly mistake.
Check out our latest analysis for MedNation
What Does MedNation's Recent Performance Look Like?
It looks like revenue growth has deserted MedNation recently, which is not something to boast about. It might be that many expect the uninspiring revenue performance to only match most other companies at best over the coming period, which has kept the P/S from rising. If you like the company, you'd be hoping this isn't the case so that you could potentially pick up some stock while it's not quite in favour.
Although there are no analyst estimates available for MedNation, take a look at this free data-rich visualisation to see how the company stacks up on earnings, revenue and cash flow.
Is There Some Revenue Growth Forecasted For MedNation?
There's an inherent assumption that a company should be matching the industry for P/S ratios like MedNation's to be considered reasonable.
Retrospectively, the last year delivered virtually the same number to the company's top line as the year before. The lack of growth did nothing to help the company's aggregate three-year performance, which is an unsavory 25% drop in revenue. Therefore, it's fair to say the revenue growth recently has been undesirable for the company.
In contrast to the company, the rest of the industry is expected to grow by 1.7% over the next year, which really puts the company's recent medium-term revenue decline into perspective.
With this information, we find it concerning that MedNation is trading at a fairly similar P/S compared to the industry. Apparently many investors in the company are way less bearish than recent times would indicate and aren't willing to let go of their stock right now. There's a good chance existing shareholders are setting themselves up for future disappointment if the P/S falls to levels more in line with the recent negative growth rates.
What We Can Learn From MedNation's P/S?
It's argued the price-to-sales ratio is an inferior measure of value within certain industries, but it can be a powerful business sentiment indicator.
The fact that MedNation currently trades at a P/S on par with the rest of the industry is surprising to us since its recent revenues have been in decline over the medium-term, all while the industry is set to grow. Even though it matches the industry, we're uncomfortable with the current P/S ratio, as this dismal revenue performance is unlikely to support a more positive sentiment for long. Unless the recent medium-term conditions improve markedly, investors will have a hard time accepting the share price as fair value.
You should always think about risks. Case in point, we've spotted 3 warning signs for MedNation you should be aware of.
Of course, profitable companies with a history of great earnings growth are generally safer bets. So you may wish to see this free collection of other companies that have reasonable P/E ratios and have grown earnings strongly.
Have feedback on this article? Concerned about the content? Get in touch with us directly. Alternatively, email editorial-team (at) simplywallst.com.
This article by Simply Wall St is general in nature. We provide commentary based on historical data and analyst forecasts only using an unbiased methodology and our articles are not intended to be financial advice. It does not constitute a recommendation to buy or sell any stock, and does not take account of your objectives, or your financial situation. We aim to bring you long-term focused analysis driven by fundamental data. Note that our analysis may not factor in the latest price-sensitive company announcements or qualitative material. Simply Wall St has no position in any stocks mentioned.
Join A Paid User Research Session
You’ll receive a US$30 Amazon Gift card for 1 hour of your time while helping us build better investing tools for the individual investors like yourself. Sign up here
