
 Yahoo Finance
 Revenues Working Against CT Automotive Group plc's (LON:CTA) Share Price
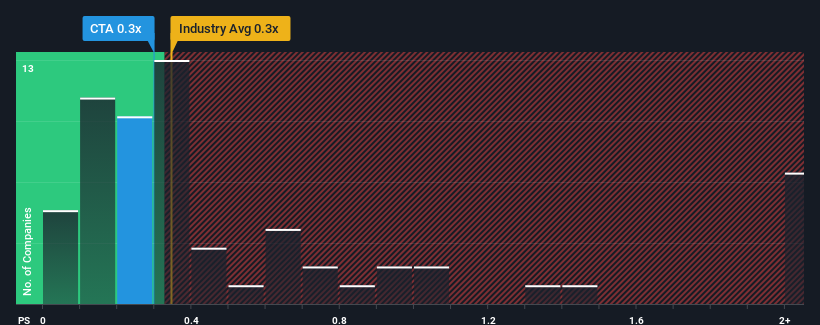
CT Automotive Group plc's (LON:CTA) price-to-sales (or "P/S") ratio of 0.3x might make it look like a buy right now compared to the Auto Components industry in the United Kingdom, where around half of the companies have P/S ratios above 1.2x and even P/S above 5x are quite common. Although, it's not wise to just take the P/S at face value as there may be an explanation why it's limited.
See our latest analysis for CT Automotive Group
What Does CT Automotive Group's P/S Mean For Shareholders?
CT Automotive Group hasn't been tracking well recently as its declining revenue compares poorly to other companies, which have seen some growth in their revenues on average. It seems that many are expecting the poor revenue performance to persist, which has repressed the P/S ratio. If you still like the company, you'd be hoping this isn't the case so that you could potentially pick up some stock while it's out of favour.
Want the full picture on analyst estimates for the company? Then our free report on CT Automotive Group will help you uncover what's on the horizon.
Do Revenue Forecasts Match The Low P/S Ratio?
In order to justify its P/S ratio, CT Automotive Group would need to produce sluggish growth that's trailing the industry.
Taking a look back first, the company's revenue growth last year wasn't something to get excited about as it posted a disappointing decline of 2.8%. That put a dampener on the good run it was having over the longer-term as its three-year revenue growth is still a noteworthy 9.8% in total. Accordingly, while they would have preferred to keep the run going, shareholders would be roughly satisfied with the medium-term rates of revenue growth.
Looking ahead now, revenue is anticipated to climb by 1.1% during the coming year according to the lone analyst following the company. Meanwhile, the rest of the industry is forecast to expand by 20%, which is noticeably more attractive.
In light of this, it's understandable that CT Automotive Group's P/S sits below the majority of other companies. Apparently many shareholders weren't comfortable holding on while the company is potentially eyeing a less prosperous future.
The Final Word
Generally, our preference is to limit the use of the price-to-sales ratio to establishing what the market thinks about the overall health of a company.
As we suspected, our examination of CT Automotive Group's analyst forecasts revealed that its inferior revenue outlook is contributing to its low P/S. Right now shareholders are accepting the low P/S as they concede future revenue probably won't provide any pleasant surprises. The company will need a change of fortune to justify the P/S rising higher in the future.
Before you settle on your opinion, we've discovered 4 warning signs for CT Automotive Group (1 is potentially serious!) that you should be aware of.
If companies with solid past earnings growth is up your alley, you may wish to see this free collection of other companies with strong earnings growth and low P/E ratios.
Have feedback on this article? Concerned about the content? Get in touch with us directly. Alternatively, email editorial-team (at) simplywallst.com.
This article by Simply Wall St is general in nature. We provide commentary based on historical data and analyst forecasts only using an unbiased methodology and our articles are not intended to be financial advice. It does not constitute a recommendation to buy or sell any stock, and does not take account of your objectives, or your financial situation. We aim to bring you long-term focused analysis driven by fundamental data. Note that our analysis may not factor in the latest price-sensitive company announcements or qualitative material. Simply Wall St has no position in any stocks mentioned.
