
 Yahoo Finance
 A Rising Share Price Has Us Looking Closely At Varta AG's (ETR:VAR1) P/E Ratio

Varta (ETR:VAR1) shareholders are no doubt pleased to see that the share price has had a great month, posting a 30% gain, recovering from prior weakness. That brought the twelve month gain to a very sharp 95%.
All else being equal, a sharp share price increase should make a stock less attractive to potential investors. While the market sentiment towards a stock is very changeable, in the long run, the share price will tend to move in the same direction as earnings per share. So some would prefer to hold off buying when there is a lot of optimism towards a stock. One way to gauge market expectations of a stock is to look at its Price to Earnings Ratio (PE Ratio). A high P/E implies that investors have high expectations of what a company can achieve compared to a company with a low P/E ratio.
Check out our latest analysis for Varta
Does Varta Have A Relatively High Or Low P/E For Its Industry?
Varta's P/E of 72.97 indicates some degree of optimism towards the stock. You can see in the image below that the average P/E (21.2) for companies in the electrical industry is a lot lower than Varta's P/E.
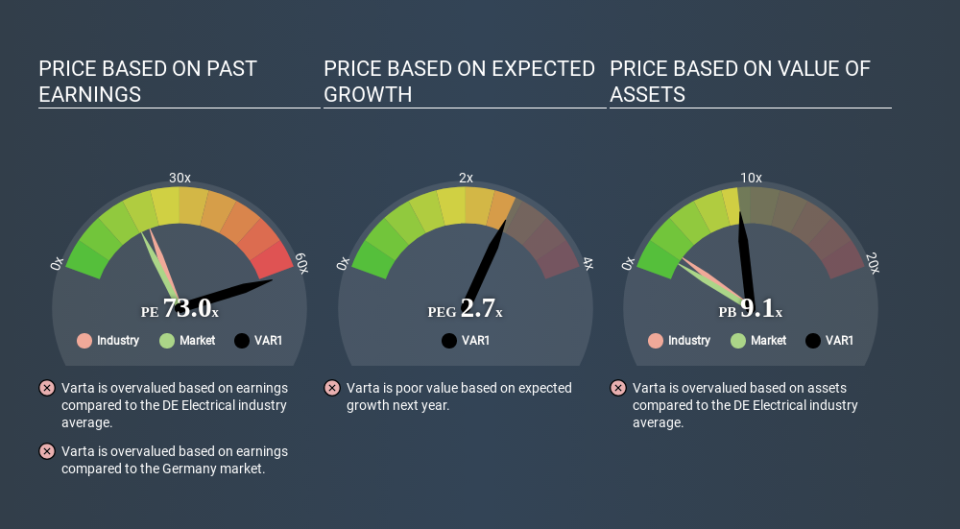
Its relatively high P/E ratio indicates that Varta shareholders think it will perform better than other companies in its industry classification. Shareholders are clearly optimistic, but the future is always uncertain. So investors should delve deeper. I like to check if company insiders have been buying or selling.
How Growth Rates Impact P/E Ratios
Earnings growth rates have a big influence on P/E ratios. Earnings growth means that in the future the 'E' will be higher. That means even if the current P/E is high, it will reduce over time if the share price stays flat. And as that P/E ratio drops, the company will look cheap, unless its share price increases.
Varta's earnings made like a rocket, taking off 93% last year. The cherry on top is that the five year growth rate was an impressive 15% per year. With that kind of growth rate we would generally expect a high P/E ratio.
Remember: P/E Ratios Don't Consider The Balance Sheet
The 'Price' in P/E reflects the market capitalization of the company. That means it doesn't take debt or cash into account. Theoretically, a business can improve its earnings (and produce a lower P/E in the future) by investing in growth. That means taking on debt (or spending its cash).
While growth expenditure doesn't always pay off, the point is that it is a good option to have; but one that the P/E ratio ignores.
How Does Varta's Debt Impact Its P/E Ratio?
Since Varta holds net cash of €103m, it can spend on growth, justifying a higher P/E ratio than otherwise.
The Verdict On Varta's P/E Ratio
With a P/E ratio of 73.0, Varta is expected to grow earnings very strongly in the years to come. The excess cash it carries is the gravy on top its fast EPS growth. So based on this analysis we'd expect Varta to have a high P/E ratio. What we know for sure is that investors have become much more excited about Varta recently, since they have pushed its P/E ratio from 56.0 to 73.0 over the last month. If you like to buy stocks that have recently impressed the market, then this one might be a candidate; but if you prefer to invest when there is 'blood in the streets', then you may feel the opportunity has passed.
When the market is wrong about a stock, it gives savvy investors an opportunity. People often underestimate remarkable growth -- so investors can make money when fast growth is not fully appreciated. So this free visual report on analyst forecasts could hold the key to an excellent investment decision.
Of course you might be able to find a better stock than Varta. So you may wish to see this free collection of other companies that have grown earnings strongly.
Love or hate this article? Concerned about the content? Get in touch with us directly. Alternatively, email editorial-team@simplywallst.com.
This article by Simply Wall St is general in nature. It does not constitute a recommendation to buy or sell any stock, and does not take account of your objectives, or your financial situation. We aim to bring you long-term focused analysis driven by fundamental data. Note that our analysis may not factor in the latest price-sensitive company announcements or qualitative material. Simply Wall St has no position in any stocks mentioned. Thank you for reading.
