
 Yahoo Finance
 A Rising Share Price Has Us Looking Closely At Tricorn Group plc's (LON:TCN) P/E Ratio

Tricorn Group (LON:TCN) shares have had a really impressive month, gaining 37%, after some slippage. But shareholders may not all be feeling jubilant, since the share price is still down 23% in the last year.
Assuming no other changes, a sharply higher share price makes a stock less attractive to potential buyers. While the market sentiment towards a stock is very changeable, in the long run, the share price will tend to move in the same direction as earnings per share. So some would prefer to hold off buying when there is a lot of optimism towards a stock. Perhaps the simplest way to get a read on investors' expectations of a business is to look at its Price to Earnings Ratio (PE Ratio). A high P/E implies that investors have high expectations of what a company can achieve compared to a company with a low P/E ratio.
View our latest analysis for Tricorn Group
Does Tricorn Group Have A Relatively High Or Low P/E For Its Industry?
We can tell from its P/E ratio of 7.70 that sentiment around Tricorn Group isn't particularly high. The image below shows that Tricorn Group has a lower P/E than the average (18.5) P/E for companies in the machinery industry.
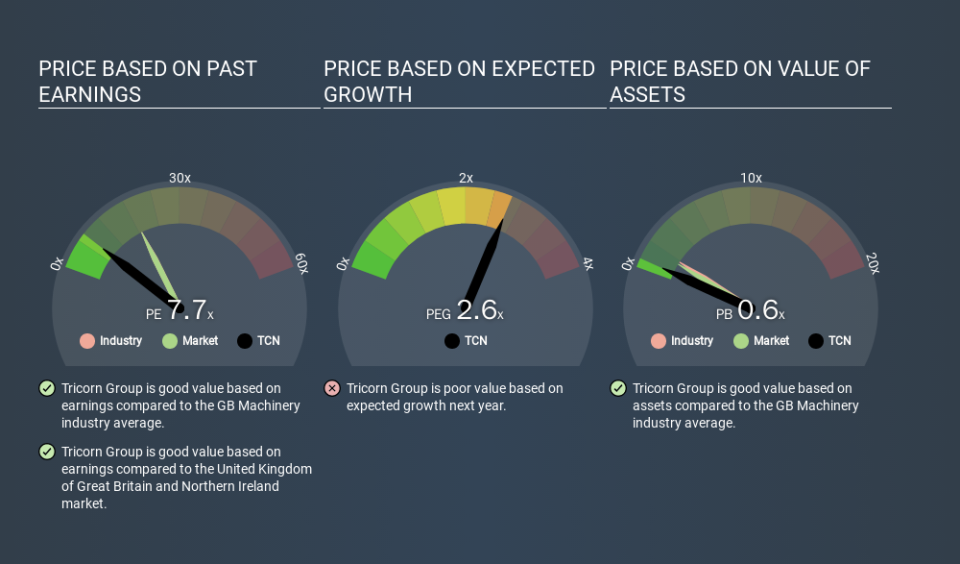
Tricorn Group's P/E tells us that market participants think it will not fare as well as its peers in the same industry. Many investors like to buy stocks when the market is pessimistic about their prospects. If you consider the stock interesting, further research is recommended. For example, I often monitor director buying and selling.
How Growth Rates Impact P/E Ratios
Probably the most important factor in determining what P/E a company trades on is the earnings growth. That's because companies that grow earnings per share quickly will rapidly increase the 'E' in the equation. Therefore, even if you pay a high multiple of earnings now, that multiple will become lower in the future. So while a stock may look expensive based on past earnings, it could be cheap based on future earnings.
Tricorn Group saw earnings per share decrease by 31% last year.
Remember: P/E Ratios Don't Consider The Balance Sheet
Don't forget that the P/E ratio considers market capitalization. That means it doesn't take debt or cash into account. The exact same company would hypothetically deserve a higher P/E ratio if it had a strong balance sheet, than if it had a weak one with lots of debt, because a cashed up company can spend on growth.
Spending on growth might be good or bad a few years later, but the point is that the P/E ratio does not account for the option (or lack thereof).
So What Does Tricorn Group's Balance Sheet Tell Us?
Net debt totals 72% of Tricorn Group's market cap. If you want to compare its P/E ratio to other companies, you should absolutely keep in mind it has significant borrowings.
The Verdict On Tricorn Group's P/E Ratio
Tricorn Group's P/E is 7.7 which is below average (18.3) in the GB market. The P/E reflects market pessimism that probably arises from the lack of recent EPS growth, paired with significant leverage. What is very clear is that the market has become less pessimistic about Tricorn Group over the last month, with the P/E ratio rising from 5.6 back then to 7.7 today. If you like to buy stocks that could be turnaround opportunities, then this one might be a candidate; but if you're more sensitive to price, then you may feel the opportunity has passed.
When the market is wrong about a stock, it gives savvy investors an opportunity. If the reality for a company is not as bad as the P/E ratio indicates, then the share price should increase as the market realizes this. So this free visualization of the analyst consensus on future earnings could help you make the right decision about whether to buy, sell, or hold.
But note: Tricorn Group may not be the best stock to buy. So take a peek at this free list of interesting companies with strong recent earnings growth (and a P/E ratio below 20).
If you spot an error that warrants correction, please contact the editor at editorial-team@simplywallst.com. This article by Simply Wall St is general in nature. It does not constitute a recommendation to buy or sell any stock, and does not take account of your objectives, or your financial situation. Simply Wall St has no position in the stocks mentioned.
We aim to bring you long-term focused research analysis driven by fundamental data. Note that our analysis may not factor in the latest price-sensitive company announcements or qualitative material. Thank you for reading.
