
 Yahoo Finance
 A Rising Share Price Has Us Looking Closely At Frasers Group plc's (LON:FRAS) P/E Ratio

It's really great to see that even after a strong run, Frasers Group (LON:FRAS) shares have been powering on, with a gain of 44% in the last thirty days. Looking back a bit further, we're also happy to report the stock is up 91% in the last year.
All else being equal, a sharp share price increase should make a stock less attractive to potential investors. While the market sentiment towards a stock is very changeable, in the long run, the share price will tend to move in the same direction as earnings per share. The implication here is that deep value investors might steer clear when expectations of a company are too high. One way to gauge market expectations of a stock is to look at its Price to Earnings Ratio (PE Ratio). A high P/E ratio means that investors have a high expectation about future growth, while a low P/E ratio means they have low expectations about future growth.
View our latest analysis for Frasers Group
How Does Frasers Group's P/E Ratio Compare To Its Peers?
Frasers Group's P/E of 20.78 indicates some degree of optimism towards the stock. You can see in the image below that the average P/E (16.6) for companies in the specialty retail industry is lower than Frasers Group's P/E.
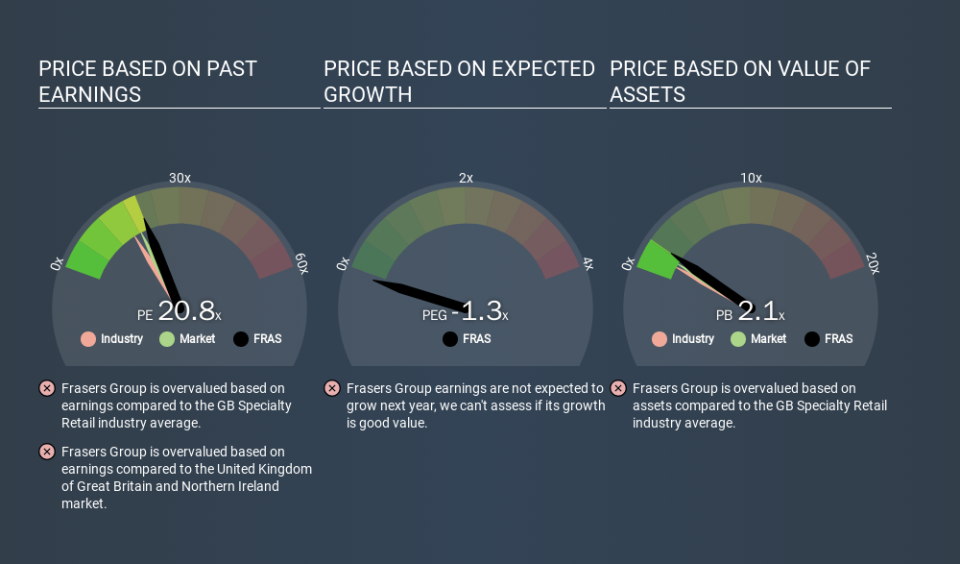
Frasers Group's P/E tells us that market participants think the company will perform better than its industry peers, going forward. The market is optimistic about the future, but that doesn't guarantee future growth. So further research is always essential. I often monitor director buying and selling.
How Growth Rates Impact P/E Ratios
When earnings fall, the 'E' decreases, over time. That means unless the share price falls, the P/E will increase in a few years. A higher P/E should indicate the stock is expensive relative to others -- and that may encourage shareholders to sell.
In the last year, Frasers Group grew EPS like Taylor Swift grew her fan base back in 2010; the 232% gain was both fast and well deserved. Unfortunately, earnings per share are down 4.6% a year, over 5 years.
Don't Forget: The P/E Does Not Account For Debt or Bank Deposits
Don't forget that the P/E ratio considers market capitalization. In other words, it does not consider any debt or cash that the company may have on the balance sheet. Hypothetically, a company could reduce its future P/E ratio by spending its cash (or taking on debt) to achieve higher earnings.
Such expenditure might be good or bad, in the long term, but the point here is that the balance sheet is not reflected by this ratio.
Frasers Group's Balance Sheet
Frasers Group's net debt is 9.7% of its market cap. It would probably trade on a higher P/E ratio if it had a lot of cash, but I doubt it is having a big impact.
The Bottom Line On Frasers Group's P/E Ratio
Frasers Group has a P/E of 20.8. That's higher than the average in its market, which is 18.5. Its debt levels do not imperil its balance sheet and its EPS growth is very healthy indeed. So on this analysis a high P/E ratio seems reasonable. What is very clear is that the market has become significantly more optimistic about Frasers Group over the last month, with the P/E ratio rising from 14.4 back then to 20.8 today. If you like to buy stocks that have recently impressed the market, then this one might be a candidate; but if you prefer to invest when there is 'blood in the streets', then you may feel the opportunity has passed.
Investors should be looking to buy stocks that the market is wrong about. If the reality for a company is better than it expects, you can make money by buying and holding for the long term. So this free visualization of the analyst consensus on future earnings could help you make the right decision about whether to buy, sell, or hold.
But note: Frasers Group may not be the best stock to buy. So take a peek at this free list of interesting companies with strong recent earnings growth (and a P/E ratio below 20).
If you spot an error that warrants correction, please contact the editor at editorial-team@simplywallst.com. This article by Simply Wall St is general in nature. It does not constitute a recommendation to buy or sell any stock, and does not take account of your objectives, or your financial situation. Simply Wall St has no position in the stocks mentioned.
We aim to bring you long-term focused research analysis driven by fundamental data. Note that our analysis may not factor in the latest price-sensitive company announcements or qualitative material. Thank you for reading.
