
 Yahoo Finance
 Are Robust Financials Driving The Recent Rally In Green Cross Health Limited's (NZSE:GXH) Stock?
Green Cross Health (NZSE:GXH) has had a great run on the share market with its stock up by a significant 7.3% over the last month. Given the company's impressive performance, we decided to study its financial indicators more closely as a company's financial health over the long-term usually dictates market outcomes. Specifically, we decided to study Green Cross Health's ROE in this article.
ROE or return on equity is a useful tool to assess how effectively a company can generate returns on the investment it received from its shareholders. In simpler terms, it measures the profitability of a company in relation to shareholder's equity.
See our latest analysis for Green Cross Health
How To Calculate Return On Equity?
The formula for return on equity is:
Return on Equity = Net Profit (from continuing operations) ÷ Shareholders' Equity
So, based on the above formula, the ROE for Green Cross Health is:
20% = NZ$36m ÷ NZ$175m (Based on the trailing twelve months to September 2022).
The 'return' is the yearly profit. That means that for every NZ$1 worth of shareholders' equity, the company generated NZ$0.20 in profit.
What Is The Relationship Between ROE And Earnings Growth?
Thus far, we have learned that ROE measures how efficiently a company is generating its profits. Depending on how much of these profits the company reinvests or "retains", and how effectively it does so, we are then able to assess a company’s earnings growth potential. Assuming all else is equal, companies that have both a higher return on equity and higher profit retention are usually the ones that have a higher growth rate when compared to companies that don't have the same features.
A Side By Side comparison of Green Cross Health's Earnings Growth And 20% ROE
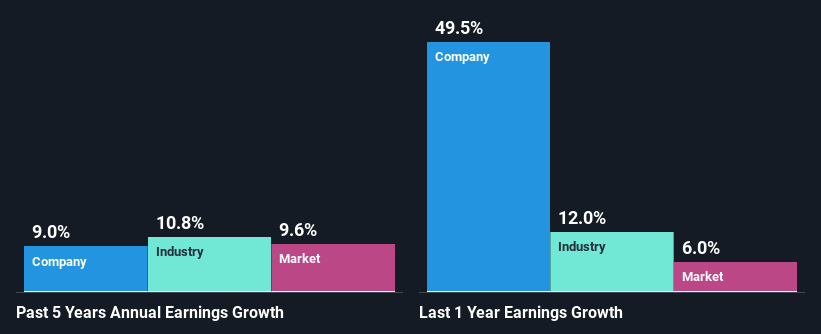
To begin with, Green Cross Health seems to have a respectable ROE. Be that as it may, the company's ROE is still quite lower than the industry average of 26%. Green Cross Health was still able to see a decent net income growth of 9.0% over the past five years. So, there might be other aspects that are positively influencing earnings growth. For example, it is possible that the company's management has made some good strategic decisions, or that the company has a low payout ratio. However, not to forget, the company does have a decent ROE to begin with, just that it is lower than the industry average. So this also provides some context to the earnings growth seen by the company.
As a next step, we compared Green Cross Health's net income growth with the industry and found that the company has a similar growth figure when compared with the industry average growth rate of 10% in the same period.
The basis for attaching value to a company is, to a great extent, tied to its earnings growth. What investors need to determine next is if the expected earnings growth, or the lack of it, is already built into the share price. This then helps them determine if the stock is placed for a bright or bleak future. One good indicator of expected earnings growth is the P/E ratio which determines the price the market is willing to pay for a stock based on its earnings prospects. So, you may want to check if Green Cross Health is trading on a high P/E or a low P/E, relative to its industry.
Is Green Cross Health Making Efficient Use Of Its Profits?
Green Cross Health has a three-year median payout ratio of 35%, which implies that it retains the remaining 65% of its profits. This suggests that its dividend is well covered, and given the decent growth seen by the company, it looks like management is reinvesting its earnings efficiently.
Besides, Green Cross Health has been paying dividends for at least ten years or more. This shows that the company is committed to sharing profits with its shareholders.
Summary
Overall, we are quite pleased with Green Cross Health's performance. Specifically, we like that it has been reinvesting a high portion of its profits at a moderate rate of return, resulting in earnings expansion. If the company continues to grow its earnings the way it has, that could have a positive impact on its share price given how earnings per share influence long-term share prices. Remember, the price of a stock is also dependent on the perceived risk. Therefore investors must keep themselves informed about the risks involved before investing in any company. You can see the 1 risk we have identified for Green Cross Health by visiting our risks dashboard for free on our platform here.
Have feedback on this article? Concerned about the content? Get in touch with us directly. Alternatively, email editorial-team (at) simplywallst.com.
This article by Simply Wall St is general in nature. We provide commentary based on historical data and analyst forecasts only using an unbiased methodology and our articles are not intended to be financial advice. It does not constitute a recommendation to buy or sell any stock, and does not take account of your objectives, or your financial situation. We aim to bring you long-term focused analysis driven by fundamental data. Note that our analysis may not factor in the latest price-sensitive company announcements or qualitative material. Simply Wall St has no position in any stocks mentioned.
Join A Paid User Research Session
You’ll receive a US$30 Amazon Gift card for 1 hour of your time while helping us build better investing tools for the individual investors like yourself. Sign up here
