
 Yahoo Finance
 With An ROE Of 0.89%, Can Cott Corporation (TSE:BCB) Catch Up To The Industry?

This analysis is intended to introduce important early concepts to people who are starting to invest and looking to gauge the potential return on investment in Cott Corporation (TSE:BCB).
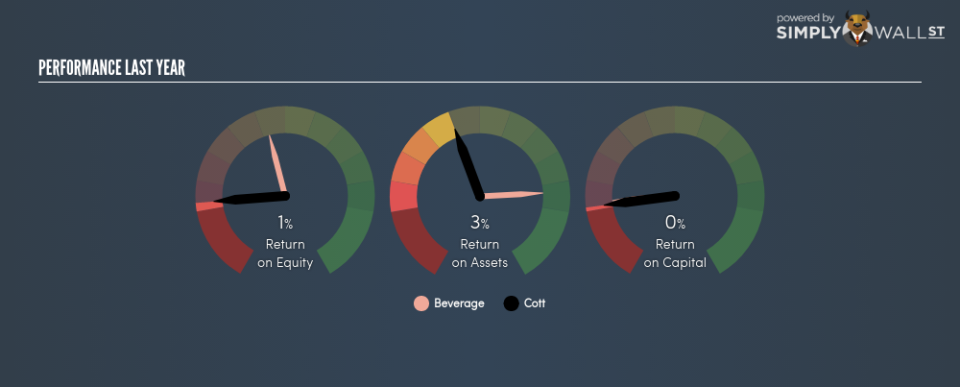
Cott Corporation (TSE:BCB) delivered a less impressive 0.89% ROE over the past year, compared to the 13.67% return generated by its industry. BCB’s results could indicate a relatively inefficient operation to its peers, and while this may be the case, it is important to understand what ROE is made up of and how it should be interpreted. Knowing these components could change your view on BCB’s performance. Today I will look at how components such as financial leverage can influence ROE which may impact the sustainability of BCB’s returns. See our latest analysis for Cott
Peeling the layers of ROE – trisecting a company’s profitability
Return on Equity (ROE) weighs Cott’s profit against the level of its shareholders’ equity. For example, if the company invests CA$1 in the form of equity, it will generate CA$0.0089 in earnings from this. Generally speaking, a higher ROE is preferred; however, there are other factors we must also consider before making any conclusions.
Return on Equity = Net Profit ÷ Shareholders Equity
ROE is assessed against cost of equity, which is measured using the Capital Asset Pricing Model (CAPM) – but let’s not dive into the details of that today. For now, let’s just look at the cost of equity number for Cott, which is 8.47%. Given a discrepancy of -7.58% between return and cost, this indicated that Cott may be paying more for its capital than what it’s generating in return. ROE can be broken down into three different ratios: net profit margin, asset turnover, and financial leverage. This is called the Dupont Formula:
Dupont Formula
ROE = profit margin × asset turnover × financial leverage
ROE = (annual net profit ÷ sales) × (sales ÷ assets) × (assets ÷ shareholders’ equity)
ROE = annual net profit ÷ shareholders’ equity
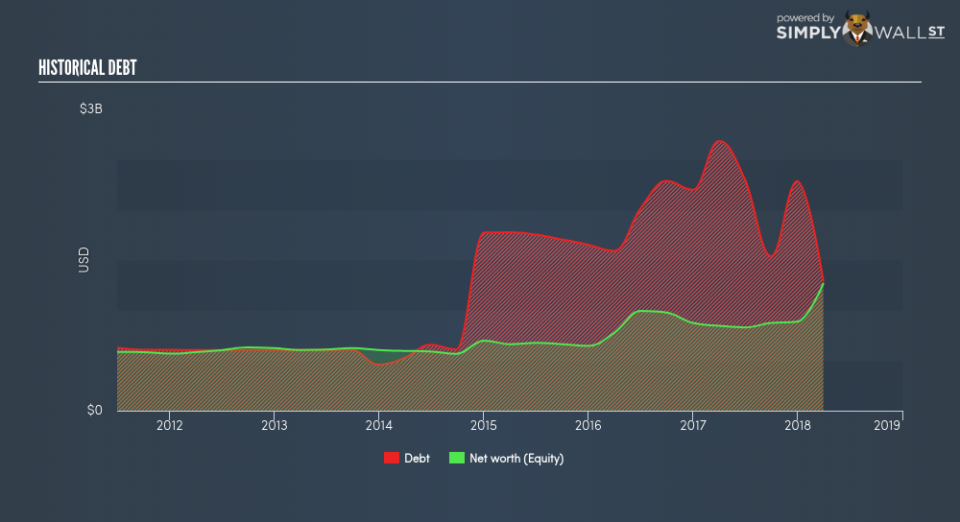
Essentially, profit margin shows how much money the company makes after paying for all its expenses. Asset turnover reveals how much revenue can be generated from Cott’s asset base. Finally, financial leverage will be our main focus today. It shows how much of assets are funded by equity and can show how sustainable the company’s capital structure is. Since ROE can be artificially increased through excessive borrowing, we should check Cott’s historic debt-to-equity ratio. At 102.43%, Cott’s debt-to-equity ratio appears balanced and indicates its ROE is generated from its capacity to increase profit without a large debt burden.
Next Steps:
While ROE is a relatively simple calculation, it can be broken down into different ratios, each telling a different story about the strengths and weaknesses of a company. Cott’s below-industry ROE is disappointing, furthermore, its returns were not even high enough to cover its own cost of equity. Although, its appropriate level of leverage means investors can be more confident in the sustainability of Cott’s return with a possible increase should the company decide to increase its debt levels. ROE is a helpful signal, but it is definitely not sufficient on its own to make an investment decision.
For Cott, there are three fundamental factors you should further research:
Financial Health: Does it have a healthy balance sheet? Take a look at our free balance sheet analysis with six simple checks on key factors like leverage and risk.
Valuation: What is Cott worth today? Is the stock undervalued, even when its growth outlook is factored into its intrinsic value? The intrinsic value infographic in our free research report helps visualize whether Cott is currently mispriced by the market.
Other High-Growth Alternatives : Are there other high-growth stocks you could be holding instead of Cott? Explore our interactive list of stocks with large growth potential to get an idea of what else is out there you may be missing!
To help readers see pass the short term volatility of the financial market, we aim to bring you a long-term focused research analysis purely driven by fundamental data. Note that our analysis does not factor in the latest price sensitive company announcements.
The author is an independent contributor and at the time of publication had no position in the stocks mentioned.
