
 Yahoo Finance
 Rogers Communications (RCI) Q1 Earnings Beat, Revenues Rise
Rogers Communications RCI reported first-quarter 2023 adjusted earnings of 81 cents per share, which increased 11.9% year over year and beat the Zacks Consensus Estimate by 3.85%.
Quarterly revenues of $2.83 billion beat the consensus mark by 4.69%.
In domestic currency (Canadian dollar), adjusted earnings increased 19.8% year over year to C$1.09 per share. Total revenues increased 6% year over year, reaching C$3.83 billion, driven primarily by revenue growth in its Wireless and Media businesses.
Rogers Communication, Inc. Price, Consensus and EPS Surprise
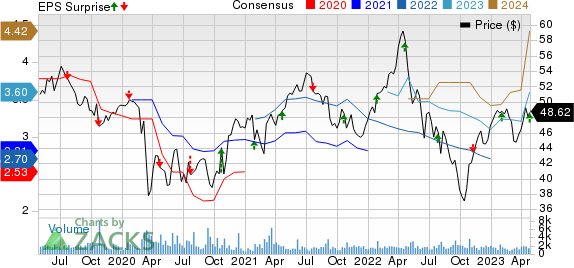
Rogers Communication, Inc. price-consensus-eps-surprise-chart | Rogers Communication, Inc. Quote
Wireless Details
Wireless (61.2% of total revenues) increased 9.6% from the year-ago quarter’s levels to C$2.34 billion as a result of higher roaming revenues associated with increased travel and a larger postpaid mobile phone subscriber base.
Service revenues increased 6.6% to C$1.83 billion, driven by higher roaming revenues associated with increased traveling and a larger mobile phone subscriber base.
Equipment revenues were up 22.3% to C$510 million because of higher device upgrades by existing subscribers and an increase in new subscribers purchasing devices.
Monthly mobile phone ARPU was C$58.26, which remained flat year over year.
As of Mar 31, 2023, the prepaid subscriber base totaled almost 1.247 million, highlighting an addition of 97K subscribers from the year-ago quarter’s levels. The monthly churn rate was 5.96% compared with 4.82% in the year-ago quarter.
As of Mar 31, 2023, the postpaid wireless subscriber base totaled 9.487 million, up 574K from the year-ago quarter’s levels. The upside can be attributed to strong operating performance, an increase in market activity by Canadians and increasing immigration levels. The monthly churn rate was 0.79% compared with 0.71% in the year-ago quarter.
Segment operating expenses increased 10.6% from the year-ago quarter’s levels to C$1.16 billion.
Adjusted EBITDA increased 8.7% year over year to C$1.17 billion. Adjusted EBITDA margin contracted 40 basis points (bps) on a year-over-year basis to 50.3%.
Cable Details
Cable revenues (26.5% of total revenues) declined 1.8% year over year to C$1.017 billion. Service revenues declined 2.3% year over year to C$1.006 billion.
As of Mar 31, 2023, the retail Internet subscriber count was nearly 2.29 million, up 53K from the year-ago quarter’s levels.
As of Mar 31, 2023, total Smart Home Monitoring subscribers reached 96K, highlighting a loss of 13K subscribers from the year-ago quarter’s reported figure. The total Home Phone subscriber count was nearly 823K, down 67K from the year-ago quarter’s figure.
The lower ARPA this quarter was a result of increased competitive promotional activity.
Equipment revenues increased 83.3% year over year to C$11 million.
Segment operating expenses decreased 5.2% year over year at C$460 million.
Adjusted EBITDA increased 1.1% year over year to C$557 million. Adjusted EBITDA margin expanded 160 bps on a year-over-year basis to 54.8%.
Media Details
Media (13.2% of total revenues) revenues increased 4.8% from the year-ago quarter to C$505 million, as a result of higher sports-related revenues, including higher Toronto Blue Jays revenues and higher advertising revenues, partially offset by lower Today's Shopping Choice revenues.
Segment operating expenses decreased 0.9% year over year to C$543 million, primarily attributed to lower Toronto Blue Jays player payroll as a result of the impact of player trades in the prior year.
Consolidated Results
Operating costs increased 5% to C$2.18 billion. As a percentage of revenues, operating costs contracted 50 bps to 56.9%.
Adjusted EBITDA increased 7.3% year over year to C$1.65 billion. Adjusted EBITDA margin expanded 50 bps to 43.1%.
Balance Sheet & Cash Flow Details
As of Mar 31, 2023, Rogers Communications had $3.3 billion of available liquidity, including $0.6 billion in cash and cash equivalents and a combined $2.8 billion available under the bank credit facility.
The company also held $12.8 billion in restricted cash and cash equivalents that was used to partially fund the cash consideration of the Shaw Transaction.
The company had $4.9 billion of available liquidity, including $0.5 billion in cash and cash equivalents and a combined $4.4 billion available under the bank credit facility at the end of the previous quarter.
Cash provided by operating activities decreased 44.3% year over year to C$453 million as a result of a higher investment in net operating assets and higher interest paid. Free cash flow decreased 28.2% year over year to C$370 million.
Rogers Communications returned $253 million in dividends to shareholders in the first quarter and declared a $0.50 per share dividend on Apr 25, 2023.
The company ended the first quarter with a debt leverage ratio (adjusted net debt/adjusted EBITDA) of 3.5, which remained unchanged sequentially.
Guidance
For full-year 2023, Roger revised and increased guidance. Roger expects total service revenue growth in the range of 26-30% from 4-7% and adjusted EBITDA growth in the range of 31-35% from 5-8%.
Free cash flow is expected in the range of $2-$2.2 billion.
Recent Developments
On Apr 3, 2023, following the completion of the Shaw Transaction, Shaw Communications Inc. was amalgamated with RCI for preliminary consideration of more than $20.3 billion, after receiving all required regulatory approvals and after the closure of the Freedom Transaction.
This consideration consisted of $18.9 billion of cash (consisting of $12.9 billion of cash and restricted cash and $6 billion borrowed from $6 billion non-revolving term loan facility) and $1.4 billion through the issuance of 23.6 million RCI Class B Non-Voting common shares (based on the opening share price of Rogers Class B Non-Voting Shares on Apr 3, 2023 of $61.33).
Shaw's primary products, along with the respective approximate subscriber bases as of Apr 3, 2023, include Internet (through Fibre+, 2 million subscribers), Video (through Total TV and Shaw Direct satellite, 1.2 million and 0.5 million subscribers, respectively), home phone services (0.9 million subscribers) and Wireless services (through Shaw Mobile to consumers in British Columbia and Alberta, 0.5 million subscribers).
Zacks Rank & Stocks to Consider
Rogers Communications currently has a Zacks Rank #3 (Hold).
Some better-ranked stocks in the Consumer Discretionary sector are SeaWorld Entertainment SEAS, PlayAGS AGS and Nerdy NRDY, each carrying a Zacks Rank #2 (Buy) at present. These companies are scheduled to report quarterly results on May 5. You can see the complete list of today’s Zacks #1 Rank (Strong Buy) stocks here.
The Zacks Consensus Estimate for SEAS first-quarter 2023 earnings is pegged at a loss of 18 cents per share, which widened by 2 cents over the past 30 days.
The Zacks Consensus Estimate for AGS first-quarter 2023 earnings is pegged at a loss of 8 cents per share, unchanged over the past 30 days.
The Zacks Consensus Estimate for NRDY’s first-quarter 2023 earnings is pegged at a loss of 5 cents per share, unchanged over the past 30 days.
Want the latest recommendations from Zacks Investment Research? Today, you can download 7 Best Stocks for the Next 30 Days. Click to get this free report
Rogers Communication, Inc. (RCI) : Free Stock Analysis Report
SeaWorld Entertainment, Inc. (SEAS) : Free Stock Analysis Report
PlayAGS, Inc. (AGS) : Free Stock Analysis Report
Nerdy Inc. (NRDY) : Free Stock Analysis Report
