
 Yahoo Finance
 Has Rogers Corporation (NYSE:ROG) Got Enough Cash?

Stocks with market capitalization between $2B and $10B, such as Rogers Corporation (NYSE:ROG) with a size of US$2.25b, do not attract as much attention from the investing community as do the small-caps and large-caps. Surprisingly though, when accounted for risk, mid-caps have delivered better returns compared to the two other categories of stocks. Today we will look at ROG’s financial liquidity and debt levels, which are strong indicators for whether the company can weather economic downturns or fund strategic acquisitions for future growth. Note that this information is centred entirely on financial health and is a top-level understanding, so I encourage you to look further into ROG here. Check out our latest analysis for Rogers
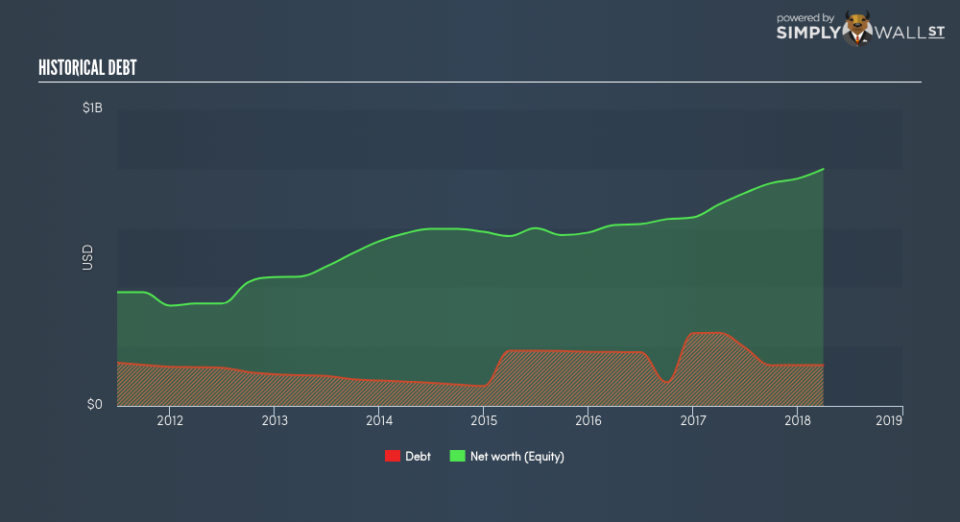
How does ROG’s operating cash flow stack up against its debt?
ROG has shrunken its total debt levels in the last twelve months, from US$244.87m to US$137.43m , which is made up of current and long term debt. With this reduction in debt, ROG currently has US$181.16m remaining in cash and short-term investments for investing into the business. Moreover, ROG has produced US$138.98m in operating cash flow during the same period of time, resulting in an operating cash to total debt ratio of 101.13%, indicating that ROG’s current level of operating cash is high enough to cover debt. This ratio can also be a sign of operational efficiency as an alternative to return on assets. In ROG’s case, it is able to generate 1.01x cash from its debt capital.
Can ROG pay its short-term liabilities?
With current liabilities at US$113.81m, it appears that the company has been able to meet these obligations given the level of current assets of US$454.52m, with a current ratio of 3.99x. Though, anything above 3x is considered high and could mean that ROG has too much idle capital in low-earning investments.
Does ROG face the risk of succumbing to its debt-load?
ROG’s level of debt is appropriate relative to its total equity, at 17.20%. ROG is not taking on too much debt commitment, which may be constraining for future growth. We can test if ROG’s debt levels are sustainable by measuring interest payments against earnings of a company. Ideally, earnings before interest and tax (EBIT) should cover net interest by at least three times. For ROG, the ratio of 22.7x suggests that interest is comfortably covered, which means that lenders may be inclined to lend more money to the company, as it is seen as safe in terms of payback.
Next Steps:
ROG has demonstrated its ability to generate sufficient levels of cash flow, while its debt hovers at a safe level. In addition to this, the company will be able to pay all of its upcoming liabilities from its current short-term assets. I admit this is a fairly basic analysis for ROG’s financial health. Other important fundamentals need to be considered alongside. I suggest you continue to research Rogers to get a more holistic view of the stock by looking at:
Future Outlook: What are well-informed industry analysts predicting for ROG’s future growth? Take a look at our free research report of analyst consensus for ROG’s outlook.
Valuation: What is ROG worth today? Is the stock undervalued, even when its growth outlook is factored into its intrinsic value? The intrinsic value infographic in our free research report helps visualize whether ROG is currently mispriced by the market.
Other High-Performing Stocks: Are there other stocks that provide better prospects with proven track records? Explore our free list of these great stocks here.
To help readers see pass the short term volatility of the financial market, we aim to bring you a long-term focused research analysis purely driven by fundamental data. Note that our analysis does not factor in the latest price sensitive company announcements.
The author is an independent contributor and at the time of publication had no position in the stocks mentioned.
