
 Yahoo Finance
 What Is Rosenbauer International's (VIE:ROS) P/E Ratio After Its Share Price Rocketed?

Those holding Rosenbauer International (VIE:ROS) shares must be pleased that the share price has rebounded 37% in the last thirty days. But unfortunately, the stock is still down by 25% over a quarter. But shareholders may not all be feeling jubilant, since the share price is still down 25% in the last year.
All else being equal, a sharp share price increase should make a stock less attractive to potential investors. While the market sentiment towards a stock is very changeable, in the long run, the share price will tend to move in the same direction as earnings per share. The implication here is that deep value investors might steer clear when expectations of a company are too high. One way to gauge market expectations of a stock is to look at its Price to Earnings Ratio (PE Ratio). A high P/E implies that investors have high expectations of what a company can achieve compared to a company with a low P/E ratio.
See our latest analysis for Rosenbauer International
How Does Rosenbauer International's P/E Ratio Compare To Its Peers?
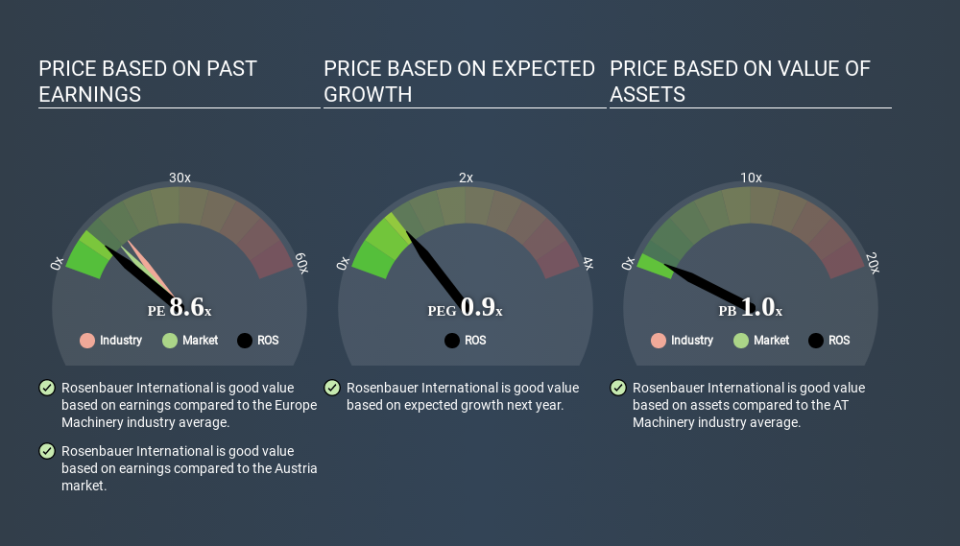
Rosenbauer International's P/E of 8.55 indicates relatively low sentiment towards the stock. If you look at the image below, you can see Rosenbauer International has a lower P/E than the average (14.0) in the machinery industry classification.
Its relatively low P/E ratio indicates that Rosenbauer International shareholders think it will struggle to do as well as other companies in its industry classification. Since the market seems unimpressed with Rosenbauer International, it's quite possible it could surprise on the upside. It is arguably worth checking if insiders are buying shares, because that might imply they believe the stock is undervalued.
How Growth Rates Impact P/E Ratios
P/E ratios primarily reflect market expectations around earnings growth rates. If earnings are growing quickly, then the 'E' in the equation will increase faster than it would otherwise. Therefore, even if you pay a high multiple of earnings now, that multiple will become lower in the future. A lower P/E should indicate the stock is cheap relative to others -- and that may attract buyers.
Rosenbauer International had pretty flat EPS growth in the last year. But EPS is up 2.7% over the last 3 years. And it has shrunk its earnings per share by 1.4% per year over the last five years. So we might expect a relatively low P/E.
A Limitation: P/E Ratios Ignore Debt and Cash In The Bank
The 'Price' in P/E reflects the market capitalization of the company. Thus, the metric does not reflect cash or debt held by the company. Theoretically, a business can improve its earnings (and produce a lower P/E in the future) by investing in growth. That means taking on debt (or spending its cash).
While growth expenditure doesn't always pay off, the point is that it is a good option to have; but one that the P/E ratio ignores.
How Does Rosenbauer International's Debt Impact Its P/E Ratio?
Net debt totals a substantial 141% of Rosenbauer International's market cap. This level of debt justifies a relatively low P/E, so remain cognizant of the debt, if you're comparing it to other stocks.
The Bottom Line On Rosenbauer International's P/E Ratio
Rosenbauer International's P/E is 8.6 which is below average (11.4) in the AT market. While the recent EPS growth is a positive, the significant amount of debt on the balance sheet may be contributing to pessimistic market expectations. What is very clear is that the market has become less pessimistic about Rosenbauer International over the last month, with the P/E ratio rising from 6.3 back then to 8.6 today. For those who like to invest in turnarounds, that might mean it's time to put the stock on a watchlist, or research it. But others might consider the opportunity to have passed.
When the market is wrong about a stock, it gives savvy investors an opportunity. As value investor Benjamin Graham famously said, 'In the short run, the market is a voting machine but in the long run, it is a weighing machine. So this free visual report on analyst forecasts could hold the key to an excellent investment decision.
But note: Rosenbauer International may not be the best stock to buy. So take a peek at this free list of interesting companies with strong recent earnings growth (and a P/E ratio below 20).
If you spot an error that warrants correction, please contact the editor at editorial-team@simplywallst.com. This article by Simply Wall St is general in nature. It does not constitute a recommendation to buy or sell any stock, and does not take account of your objectives, or your financial situation. Simply Wall St has no position in the stocks mentioned.
We aim to bring you long-term focused research analysis driven by fundamental data. Note that our analysis may not factor in the latest price-sensitive company announcements or qualitative material. Thank you for reading.
