
 Yahoo Finance
 Royce Investment Partners Commentary: 2Q24 Small-Cap Recap
An Ugh-ly Quarter for Small-Caps
2024's second quarter saw the U.S. economy remain in expansion mode (now at 49 consecutive months and counting) while employment remained strong. Perhaps most important, inflation continued to moderate, keeping hope alive for at least one interest rate reduction from the Fed in 2024. Against this favorable backdrop, the spoils of equity market performance accrued to the biggest names as mega-cap mania rolled on.
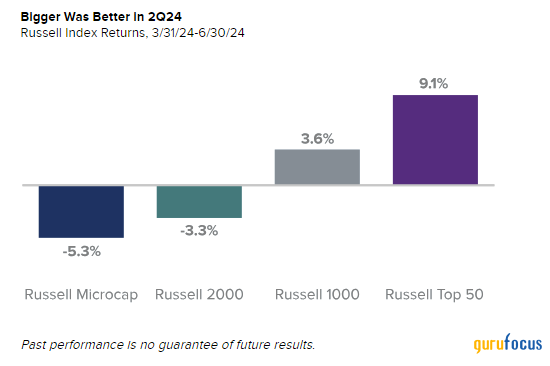
In and of itself, strong performance for the market's behemoths does not preclude the same for our chosen asset class. The small-cap Russell 2000 Index, however, finished the second quarter in the red. In what has become a familiar and unfortunate pattern over the last few years, quarterly returns were better the farther up the capitalization scale you went: The Russell Microcap Index lost -5.3%, and the Russell 2000 fell -3.3% while the large-cap Russell 1000 Index rose 3.6% and the mega-cap Russell Top 50 Index advanced 9.1%.
And, while small-cap returns were in the black for the year-to-date ended 6/30/24, with the Russell 2000 gaining 1.7%, the Russell Microcap remained in the red, down -0.8%. In addition, both indexes were behind their larger peers, with the Russell 1000 up 14.2% and the Russell Top 50 gaining 22.1%. With the Russell 2000 trailing its large-cap counterpart by nearly 130 base points through the end of June, small-caps experienced their worst first six months to a year ever versus large-caps since each index's inception on 12/31/78. The same was true for the spread between the Russell Microcap and the Russell 1000. Moreover, the Russell 1000 hit a new high 11 times in 2Q24 while the Russell 2000 finished June -12.8% off its prior peak on 11/8/21.
The key question, then, is, when will this long large-cap outperformance cycle end? We offer our thoughts on that critical issue below.
Small-Cap Value Goes Out of Style in 2Q24
With small-caps overall faring poorly in the quarter, the expectation would be for small-cap value to hold its value better than its growth sibling. This was not the case in 2Q24, however, as the Russell 2000 Value Index was down -3.6% while the Russell 2000 Growth Index declined -2.9%. This is a comparatively rare occurrence. In 62 down quarters since each index's inception on 12/31/78, the Russell 2000 Value has underperformed in only 15 of them, or 24% of the time.
Looking at longer-term periods, the Russell 2000 value beat the Russell 2000 Growth for the 3- and 5-year periods ended 6/30/24 while small-cap growth had the advantage for the 1- and 10-year periods.
Elsewhere in Equities
Results outside the U.S. hewed to a similar pattern, though with a narrower spread and both small- and large-cap indexes finishing June in the black. The MSCI ACWI ex-USA Small-Cap Index was up 0.7% in 2Q24 versus a 1.4% gain for the MSCI ACWI ex-USA Large-Cap Index.
Returning stateside, the tech-laden Nasdaq enjoyed a fine quarter, up 8.5%driven by the same mega-cap Magnificent 7' cohort of Alphabet, Amazon, Apple, Meta, Microsoft, Nvidia, and Tesla that dominated both the Russell 1000 and Russell Top 50. Interestingly, the S&P SmallCap 600 Index finished 2Q24 with a similar returna loss of -3.1%to the Russell 2000 Growth, even as the former serves as a rough proxy for small-cap quality because admittance requires companies to meet investability and financial viability criteria, including positive as-reported earnings over the most recent quarter and the most recent four quarters summed together. Needless to say, this was yet another data point to sum up a curious and confounding quarter.
The Small-Cap Sector Story
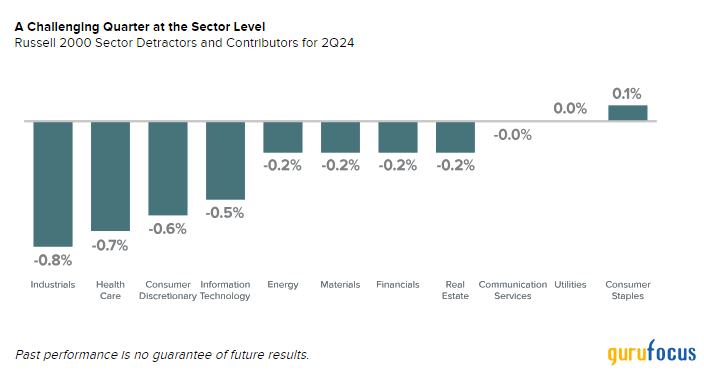
With the economy still growingeven as certain areas appeared to be plateauing or slowingit was odd that defensive sectors detracted less from small-cap performance than their more economically sensitive cyclical siblings. Within the Russell 2000, the top detractors at the sector level in 2Q24 were Industrials, Health Care, Consumer Discretionary, and Information Technology. Consumer Staples was the only sector that made a positive contribution to quarterly returns, with Utilities and Communication Services being essentially flat.
The year-to-date story was brighter, though only marginally. Cyclicals finished in the black for the six-month period ended 6/30/24 while Defensives detracted. Four out of 11 sectors contributed to year-to-date results: Information Technology, Industrials, Energy, and Consumer Staples. The biggest detractors were Financials (thanks to a significant downdraft for banks) , Real Estate, Communication Services, and Consumer Discretionary.
The Market (Still) Runs on Earnings (Which Is Good News for Active Small-Cap Management)
We sympathize with those investors who are frustrated with the current extended period of small-cap underperformance, though our conviction that small-cap will recapture its historical role of outperformance remains as strong as ever. So, while pinning a date for the asset class's renewed market leadership lies well beyond our own (and anyone else's) expertise, we do know that all market cycles are finite, though the timing almost always tests the patience of investors in the underperforming area.
We have also been small-cap specialists with a long-term investment horizon for long enough to know that patience really is a virtueand that finding attractively valued opportunities during periods of relative underperformance creates the foundation for rewarding long-term results.
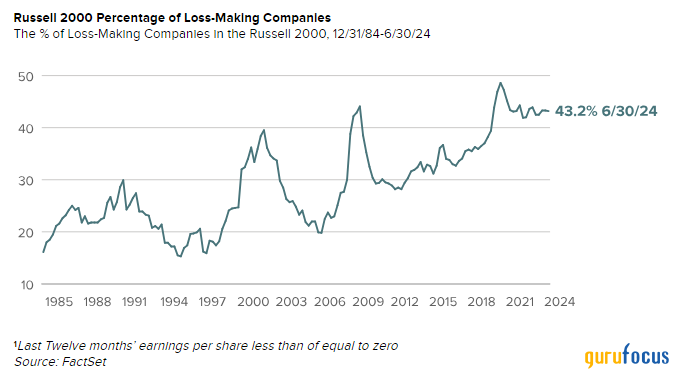
Equally, if not more important is that active management within small-cap has done bettermarkedly so in some casesover the last several years (and we are very pleased that this observation encompasses our major domestic Strategies). We also anticipate that active managers who focus on earnings growth remain best positioned for strong performance going forward. First, the Russell 2000 ended June with a near-record number of companies with no earnings.
Second, earnings acceleration is expected to be higher for small-cap companies than for large-cap businesses through the end of 2024.
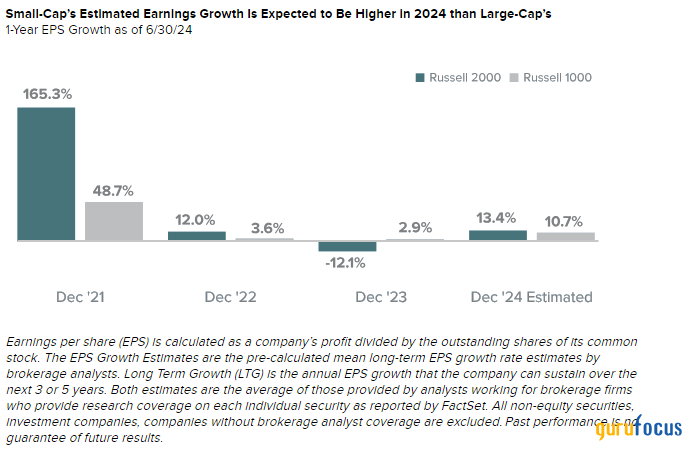
As the U.S. economy sees an increase in the tangible benefits of reshoring, the CHIPS Act, and infrastructure improvements, select small-cap companies are poised to benefit in the form of robust earnings growthwhich should be create significant advantage for those active small-cap managers who focus on profitable companies and other fundamental measures of financial and operational strength.
All performance information reflects past performance, is presented on a total return basis, reflects the reinvestment of distributions, and does not reflect the deduction of taxes a shareholder would pay on Fund distributions or the redemption of Fund shares. Past performance is no guarantee of future results. Investment return and principal value of an investment will fluctuate, so that shares may be worth more or less than their original cost when redeemed. Current performance may be higher or lower than performance quoted. Current month-end performance may be obtained at www.royceinvest.com. All performance and expense information reflects results of the Funds' oldest share Class (Investment Class or Service Class, as the case may be). Price and total return information is based on net asset values calculated for shareholder transactions. Annual gross operating expenses reflect the Fund's gross total annual operating expenses and include management fees, any 12b-1 distribution and service fees, other expenses, and any applicable acquired fund fees and expenses. Annual net operating expenses reflect contractual fee waivers and/or expense reimbursements. All expense information is reported as of the Fund's most current prospectus. Royce & Associates has contractually agreed to waive fees and/or reimburse operating expenses, excluding brokerage commissions, taxes, interest, litigation expenses, acquired fund fees and expenses, and other expenses not borne in the ordinary course of business, to the extent necessary to maintain net operating expenses at or below: 1.34% for Royce Dividend Value Fund-Service Class; 1.44% for Royce International Premier Fund (Trades, Portfolio)-Service Class; 1.24% for Royce Micro-Cap Fund Investment Class; and 1.49% for each the Royce Global Financial Services-Service Class, Small-Cap Value-Service Class, and Smaller-Companies Growth Funds-Service Class through April 30, 2025. Acquired fund fees and expenses reflect the estimated amount of the fees and expenses incurred indirectly by the Fund through its investments in mutual funds and other investment companies.
This article first appeared on GuruFocus.
