
 Yahoo Finance
 Is RSA Insurance Group plc's (LON:RSA) High P/E Ratio A Problem For Investors?

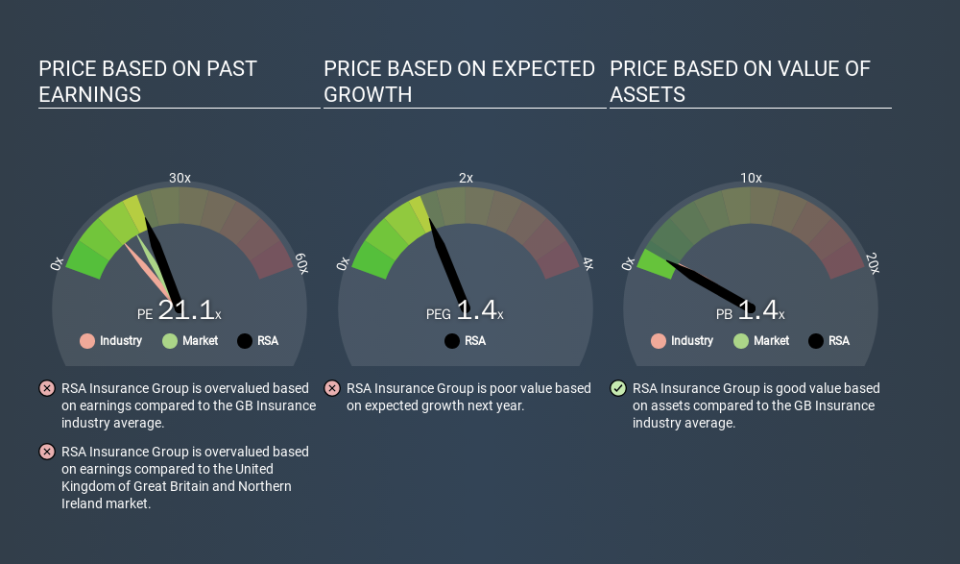
The goal of this article is to teach you how to use price to earnings ratios (P/E ratios). We'll look at RSA Insurance Group plc's (LON:RSA) P/E ratio and reflect on what it tells us about the company's share price. RSA Insurance Group has a price to earnings ratio of 21.15, based on the last twelve months. That corresponds to an earnings yield of approximately 4.7%.
Check out our latest analysis for RSA Insurance Group
How Do You Calculate A P/E Ratio?
The formula for P/E is:
Price to Earnings Ratio = Price per Share ÷ Earnings per Share (EPS)
Or for RSA Insurance Group:
P/E of 21.15 = £5.37 ÷ £0.25 (Based on the trailing twelve months to June 2019.)
Is A High Price-to-Earnings Ratio Good?
A higher P/E ratio implies that investors pay a higher price for the earning power of the business. That is not a good or a bad thing per se, but a high P/E does imply buyers are optimistic about the future.
How Does RSA Insurance Group's P/E Ratio Compare To Its Peers?
One good way to get a quick read on what market participants expect of a company is to look at its P/E ratio. The image below shows that RSA Insurance Group has a higher P/E than the average (12.9) P/E for companies in the insurance industry.
That means that the market expects RSA Insurance Group will outperform other companies in its industry. Shareholders are clearly optimistic, but the future is always uncertain. So investors should delve deeper. I like to check if company insiders have been buying or selling.
How Growth Rates Impact P/E Ratios
Probably the most important factor in determining what P/E a company trades on is the earnings growth. That's because companies that grow earnings per share quickly will rapidly increase the 'E' in the equation. And in that case, the P/E ratio itself will drop rather quickly. So while a stock may look expensive based on past earnings, it could be cheap based on future earnings.
RSA Insurance Group's earnings per share fell by 14% in the last twelve months. But over the longer term (3 years), earnings per share have increased by 27%.
A Limitation: P/E Ratios Ignore Debt and Cash In The Bank
Don't forget that the P/E ratio considers market capitalization. So it won't reflect the advantage of cash, or disadvantage of debt. Theoretically, a business can improve its earnings (and produce a lower P/E in the future) by investing in growth. That means taking on debt (or spending its cash).
While growth expenditure doesn't always pay off, the point is that it is a good option to have; but one that the P/E ratio ignores.
RSA Insurance Group's Balance Sheet
Since RSA Insurance Group holds net cash of UK£247m, it can spend on growth, justifying a higher P/E ratio than otherwise.
The Bottom Line On RSA Insurance Group's P/E Ratio
RSA Insurance Group trades on a P/E ratio of 21.1, which is above its market average of 17.1. The recent drop in earnings per share would make some investors cautious, but the healthy balance sheet means the company retains potential for future growth. If fails to eventuate, the current high P/E could prove to be temporary, as the share price falls.
Investors have an opportunity when market expectations about a stock are wrong. If the reality for a company is better than it expects, you can make money by buying and holding for the long term. So this free visualization of the analyst consensus on future earnings could help you make the right decision about whether to buy, sell, or hold.
Of course you might be able to find a better stock than RSA Insurance Group. So you may wish to see this free collection of other companies that have grown earnings strongly.
If you spot an error that warrants correction, please contact the editor at editorial-team@simplywallst.com. This article by Simply Wall St is general in nature. It does not constitute a recommendation to buy or sell any stock, and does not take account of your objectives, or your financial situation. Simply Wall St has no position in the stocks mentioned.
We aim to bring you long-term focused research analysis driven by fundamental data. Note that our analysis may not factor in the latest price-sensitive company announcements or qualitative material. Thank you for reading.
