
 Yahoo Finance
 Sabien Technology Group Plc (LON:SNT) Earns A Nice Return On Capital Employed

Today we'll look at Sabien Technology Group Plc (LON:SNT) and reflect on its potential as an investment. In particular, we'll consider its Return On Capital Employed (ROCE), as that can give us insight into how profitably the company is able to employ capital in its business.
First, we'll go over how we calculate ROCE. Then we'll compare its ROCE to similar companies. And finally, we'll look at how its current liabilities are impacting its ROCE.
Understanding Return On Capital Employed (ROCE)
ROCE measures the 'return' (pre-tax profit) a company generates from capital employed in its business. Generally speaking a higher ROCE is better. Ultimately, it is a useful but imperfect metric. Author Edwin Whiting says to be careful when comparing the ROCE of different businesses, since 'No two businesses are exactly alike.
So, How Do We Calculate ROCE?
The formula for calculating the return on capital employed is:
Return on Capital Employed = Earnings Before Interest and Tax (EBIT) ÷ (Total Assets - Current Liabilities)
Or for Sabien Technology Group:
0.19 = UK£183k ÷ (UK£1.1m - UK£136k) (Based on the trailing twelve months to June 2019.)
Therefore, Sabien Technology Group has an ROCE of 19%.
Check out our latest analysis for Sabien Technology Group
Does Sabien Technology Group Have A Good ROCE?
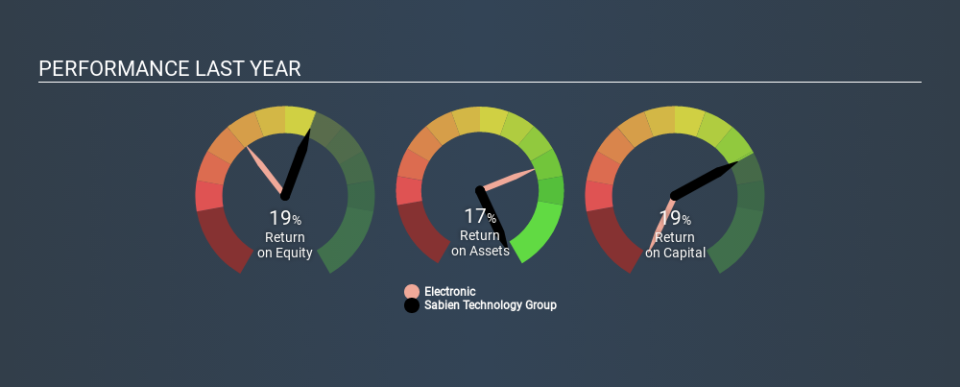
ROCE is commonly used for comparing the performance of similar businesses. In our analysis, Sabien Technology Group's ROCE is meaningfully higher than the 12% average in the Electronic industry. We would consider this a positive, as it suggests it is using capital more effectively than other similar companies. Regardless of the industry comparison, in absolute terms, Sabien Technology Group's ROCE currently appears to be excellent.
Sabien Technology Group delivered an ROCE of 19%, which is better than 3 years ago, as was making losses back then. That implies the business has been improving. You can see in the image below how Sabien Technology Group's ROCE compares to its industry. Click to see more on past growth.
Remember that this metric is backwards looking - it shows what has happened in the past, and does not accurately predict the future. ROCE can be deceptive for cyclical businesses, as returns can look incredible in boom times, and terribly low in downturns. This is because ROCE only looks at one year, instead of considering returns across a whole cycle. If Sabien Technology Group is cyclical, it could make sense to check out this free graph of past earnings, revenue and cash flow.
What Are Current Liabilities, And How Do They Affect Sabien Technology Group's ROCE?
Current liabilities include invoices, such as supplier payments, short-term debt, or a tax bill, that need to be paid within 12 months. Due to the way ROCE is calculated, a high level of current liabilities makes a company look as though it has less capital employed, and thus can (sometimes unfairly) boost the ROCE. To counter this, investors can check if a company has high current liabilities relative to total assets.
Sabien Technology Group has total assets of UK£1.1m and current liabilities of UK£136k. Therefore its current liabilities are equivalent to approximately 13% of its total assets. This is quite a low level of current liabilities which would not greatly boost the already high ROCE.
What We Can Learn From Sabien Technology Group's ROCE
With low current liabilities and a high ROCE, Sabien Technology Group could be worthy of further investigation. Sabien Technology Group looks strong on this analysis, but there are plenty of other companies that could be a good opportunity . Here is a free list of companies growing earnings rapidly.
If you like to buy stocks alongside management, then you might just love this free list of companies. (Hint: insiders have been buying them).
If you spot an error that warrants correction, please contact the editor at editorial-team@simplywallst.com. This article by Simply Wall St is general in nature. It does not constitute a recommendation to buy or sell any stock, and does not take account of your objectives, or your financial situation. Simply Wall St has no position in the stocks mentioned.
We aim to bring you long-term focused research analysis driven by fundamental data. Note that our analysis may not factor in the latest price-sensitive company announcements or qualitative material. Thank you for reading.
