
 Yahoo Finance
 Sabre Insurance Group plc's (LON:SBRE) Stock Going Strong But Fundamentals Look Weak: What Implications Could This Have On The Stock?
Most readers would already be aware that Sabre Insurance Group's (LON:SBRE) stock increased significantly by 13% over the past month. However, in this article, we decided to focus on its weak fundamentals, as long-term financial performance of a business is what ultimatley dictates market outcomes. In this article, we decided to focus on Sabre Insurance Group's ROE.
Return on equity or ROE is an important factor to be considered by a shareholder because it tells them how effectively their capital is being reinvested. In simpler terms, it measures the profitability of a company in relation to shareholder's equity.
See our latest analysis for Sabre Insurance Group
How Is ROE Calculated?
Return on equity can be calculated by using the formula:
Return on Equity = Net Profit (from continuing operations) ÷ Shareholders' Equity
So, based on the above formula, the ROE for Sabre Insurance Group is:
6.9% = UK£16m ÷ UK£227m (Based on the trailing twelve months to June 2022).
The 'return' is the profit over the last twelve months. That means that for every £1 worth of shareholders' equity, the company generated £0.07 in profit.
What Is The Relationship Between ROE And Earnings Growth?
Thus far, we have learned that ROE measures how efficiently a company is generating its profits. Depending on how much of these profits the company reinvests or "retains", and how effectively it does so, we are then able to assess a company’s earnings growth potential. Assuming everything else remains unchanged, the higher the ROE and profit retention, the higher the growth rate of a company compared to companies that don't necessarily bear these characteristics.
Sabre Insurance Group's Earnings Growth And 6.9% ROE
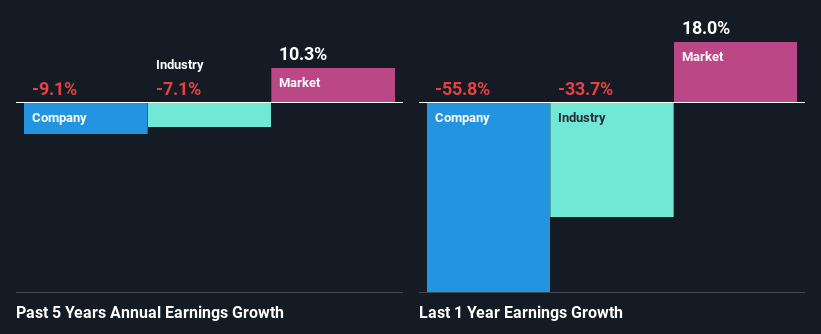
At first glance, Sabre Insurance Group's ROE doesn't look very promising. A quick further study shows that the company's ROE doesn't compare favorably to the industry average of 10% either. For this reason, Sabre Insurance Group's five year net income decline of 9.1% is not surprising given its lower ROE. However, there could also be other factors causing the earnings to decline. For example, it is possible that the business has allocated capital poorly or that the company has a very high payout ratio.
As a next step, we compared Sabre Insurance Group's performance with the industry and found thatSabre Insurance Group's performance is depressing even when compared with the industry, which has shrunk its earnings at a rate of 7.1% in the same period, which is a slower than the company.
Earnings growth is a huge factor in stock valuation. What investors need to determine next is if the expected earnings growth, or the lack of it, is already built into the share price. By doing so, they will have an idea if the stock is headed into clear blue waters or if swampy waters await. If you're wondering about Sabre Insurance Group's's valuation, check out this gauge of its price-to-earnings ratio, as compared to its industry.
Is Sabre Insurance Group Making Efficient Use Of Its Profits?
With a high three-year median payout ratio of 70% (implying that 30% of the profits are retained), most of Sabre Insurance Group's profits are being paid to shareholders, which explains the company's shrinking earnings. With only a little being reinvested into the business, earnings growth would obviously be low or non-existent. Our risks dashboard should have the 2 risks we have identified for Sabre Insurance Group.
Additionally, Sabre Insurance Group has paid dividends over a period of four years, which means that the company's management is rather focused on keeping up its dividend payments, regardless of the shrinking earnings. Upon studying the latest analysts' consensus data, we found that the company's future payout ratio is expected to rise to 92% over the next three years. Regardless, the future ROE for Sabre Insurance Group is speculated to rise to 14% despite the anticipated increase in the payout ratio. There could probably be other factors that could be driving the future growth in the ROE.
Conclusion
On the whole, Sabre Insurance Group's performance is quite a big let-down. The company has seen a lack of earnings growth as a result of retaining very little profits and whatever little it does retain, is being reinvested at a very low rate of return. That being so, the latest industry analyst forecasts show that the analysts are expecting to see a huge improvement in the company's earnings growth rate. To know more about the latest analysts predictions for the company, check out this visualization of analyst forecasts for the company.
Have feedback on this article? Concerned about the content? Get in touch with us directly. Alternatively, email editorial-team (at) simplywallst.com.
This article by Simply Wall St is general in nature. We provide commentary based on historical data and analyst forecasts only using an unbiased methodology and our articles are not intended to be financial advice. It does not constitute a recommendation to buy or sell any stock, and does not take account of your objectives, or your financial situation. We aim to bring you long-term focused analysis driven by fundamental data. Note that our analysis may not factor in the latest price-sensitive company announcements or qualitative material. Simply Wall St has no position in any stocks mentioned.
Join A Paid User Research Session
You’ll receive a US$30 Amazon Gift card for 1 hour of your time while helping us build better investing tools for the individual investors like yourself. Sign up here
