
 Yahoo Finance
 SAF-Holland And Two More Leading Dividend Stocks
Amid a backdrop of economic uncertainties and fluctuating markets, Germany's DAX index showed resilience with a modest rise of 0.40% this week. As investors navigate through these turbulent times, dividend stocks like SAF-Holland emerge as potential beacons of stability due to their ability to provide regular income streams.
Top 10 Dividend Stocks In Germany
Name | Dividend Yield | Dividend Rating |
Allianz (XTRA:ALV) | 5.28% | ★★★★★★ |
Deutsche Post (XTRA:DHL) | 4.64% | ★★★★★★ |
INDUS Holding (XTRA:INH) | 4.96% | ★★★★★☆ |
OVB Holding (XTRA:O4B) | 4.76% | ★★★★★☆ |
DATA MODUL Produktion und Vertrieb von elektronischen Systemen (XTRA:DAM) | 6.71% | ★★★★★☆ |
Südzucker (XTRA:SZU) | 6.39% | ★★★★★☆ |
MLP (XTRA:MLP) | 5.11% | ★★★★★☆ |
Deutsche Telekom (XTRA:DTE) | 3.24% | ★★★★★☆ |
Mercedes-Benz Group (XTRA:MBG) | 8.04% | ★★★★★☆ |
Uzin Utz (XTRA:UZU) | 3.17% | ★★★★★☆ |
Click here to see the full list of 29 stocks from our Top Dividend Stocks screener.
Let's explore several standout options from the results in the screener.
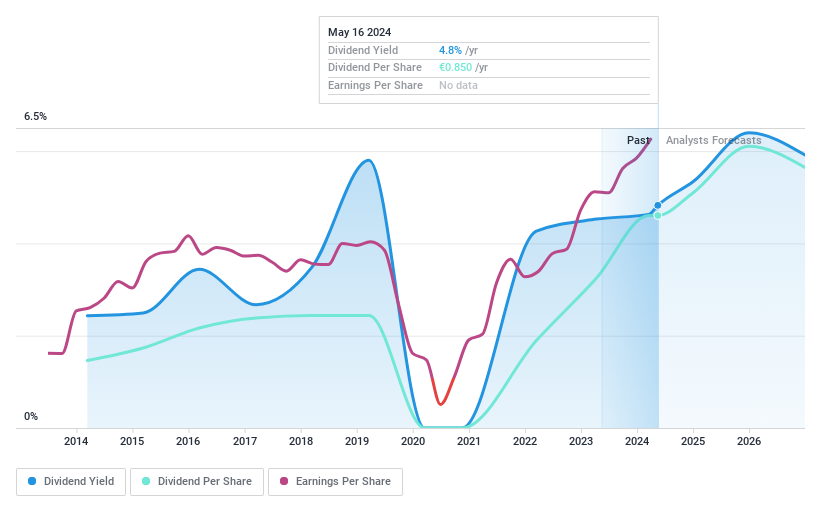
SAF-Holland
Simply Wall St Dividend Rating: ★★★★☆☆
Overview: SAF-Holland SE is a company that manufactures and supplies chassis-related assemblies and components for trailers, trucks, semi-trailers, and buses, with a market capitalization of approximately €839.79 million.
Operations: SAF-Holland SE generates its revenue primarily from three geographical segments: €951.75 million from Europe, the Middle East, and Africa (EMEA), €898.79 million from the Americas, and €280.64 million from Asia/Pacific including China and India.
Dividend Yield: 4.6%
SAF-Holland SE, despite a volatile dividend history over the past decade, has shown recent improvements in financial performance with a 28% earnings growth last year and projections of 9.18% annual earnings growth. The company's dividends are well-covered by both earnings and cash flows, with payout ratios at 44.6% and cash payout ratios at 31.6%, respectively. However, its current dividend yield of 4.59% is slightly below the top quartile in the German market at 4.63%. Additionally, SAF-Holland trades at a significant discount to estimated fair value by 43.6%. High debt levels remain a concern for long-term sustainability.
Get an in-depth perspective on SAF-Holland's performance by reading our dividend report here.
Our valuation report here indicates SAF-Holland may be undervalued.
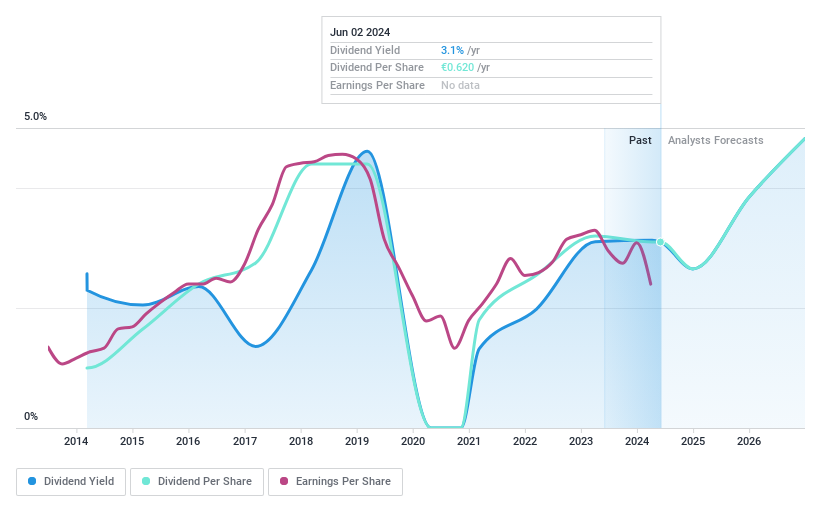
technotrans
Simply Wall St Dividend Rating: ★★★★☆☆
Overview: Technotrans SE is a global technology and services company with a market capitalization of approximately €127.45 million.
Operations: Technotrans SE generates revenue primarily through two segments: Technology, which brought in €188.31 million, and Services, contributing €63.04 million.
Dividend Yield: 3.4%
Technotrans SE's recent financial performance shows a decline, with Q1 2024 revenue dropping to €56.04 million from €68.31 million year-over-year and net income falling drastically to €0.059 million from €2.2 million. The company's dividend yield stands at 3.47%, below the top quartile of German dividend stocks at 4.63%. Dividends appear sustainable with a payout ratio of 64.7% and cash payout ratio of 37.5%, despite a history of unstable and volatile dividends over the past decade.
Delve into the full analysis dividend report here for a deeper understanding of technotrans.
Our valuation report here indicates technotrans may be overvalued.
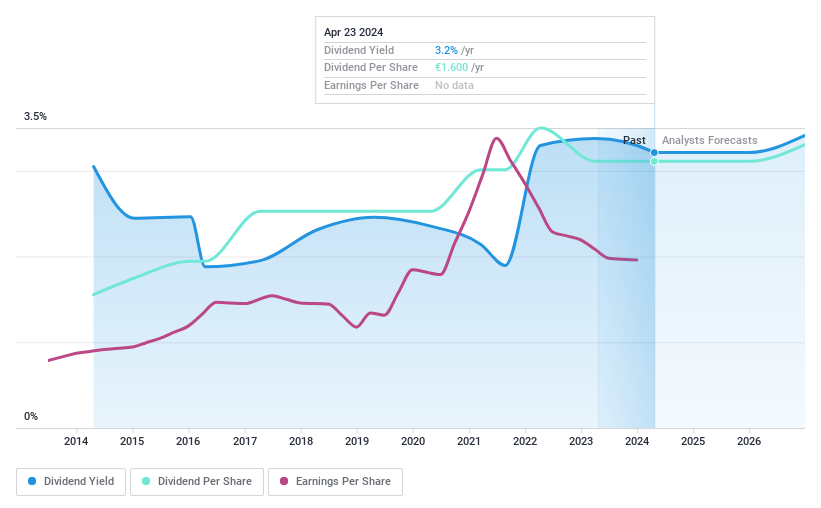
Uzin Utz
Simply Wall St Dividend Rating: ★★★★★☆
Overview: Uzin Utz SE, with a market capitalization of €254.74 million, is engaged in the development, manufacturing, and international sale of construction chemical system products across Germany, the United States, and the Netherlands.
Operations: Uzin Utz SE's revenue is primarily generated from its segments in Germany, with €210.21 million from Laying Systems, €32.53 million from Machinery and Tools, and €35.16 million from Surface Care and Refinement; other significant contributions come from Western Europe (€83.83 million), the Netherlands with €36.31 million in Wholesale and €82.87 million in Laying Systems, the USA (€73.33 million), and Southern/Eastern Europe (€25.98 million).
Dividend Yield: 3.2%
Uzin Utz SE offers a consistent dividend yield of 3.17%, which is lower than the top German dividend payers but is supported by a solid track record of stable and growing payouts over the past decade. The company's dividends are well-covered, with an earnings payout ratio of 35.7% and a cash flow payout ratio of 23.9%. Additionally, Uzin Utz's price-to-earnings ratio at 11.3x sits below the German market average, indicating potential value for investors despite its modest yield compared to peers.
Turning Ideas Into Actions
Access the full spectrum of 29 Top Dividend Stocks by clicking on this link.
Are any of these part of your asset mix? Tap into the analytical power of Simply Wall St's portfolio to get a 360-degree view on how they're shaping up.
Enhance your investing ability with the Simply Wall St app and enjoy free access to essential market intelligence spanning every continent.
Ready For A Different Approach?
Explore high-performing small cap companies that haven't yet garnered significant analyst attention.
Fuel your portfolio with companies showing strong growth potential, backed by optimistic outlooks both from analysts and management.
Find companies with promising cash flow potential yet trading below their fair value.
This article by Simply Wall St is general in nature. We provide commentary based on historical data and analyst forecasts only using an unbiased methodology and our articles are not intended to be financial advice. It does not constitute a recommendation to buy or sell any stock, and does not take account of your objectives, or your financial situation. We aim to bring you long-term focused analysis driven by fundamental data. Note that our analysis may not factor in the latest price-sensitive company announcements or qualitative material. Simply Wall St has no position in any stocks mentioned.
Companies discussed in this article include XTRA:SFQ XTRA:UZU and
Have feedback on this article? Concerned about the content? Get in touch with us directly. Alternatively, email editorial-team@simplywallst.com
