
 Yahoo Finance
 Is Saga plc’s (LON:SAGA) PE Ratio A Signal To Buy For Investors?

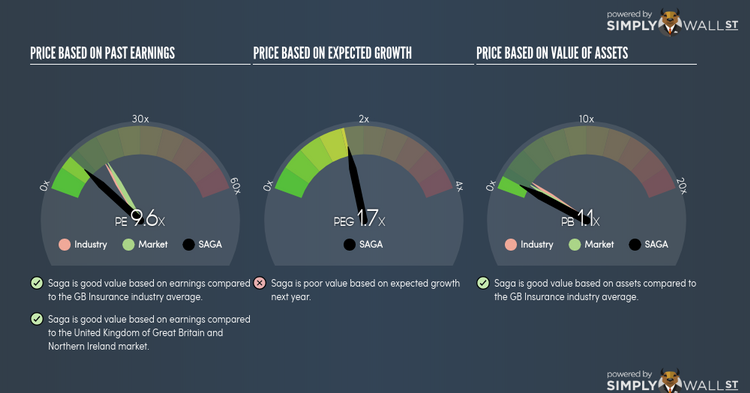
Saga plc (LSE:SAGA) is trading with a trailing P/E of 9.6x, which is lower than the industry average of 16.4x. While SAGA might seem like an attractive stock to buy, it is important to understand the assumptions behind the P/E ratio before you make any investment decisions. Today, I will deconstruct the P/E ratio and highlight what you need to be careful of when using the P/E ratio. Check out our latest analysis for Saga
Demystifying the P/E ratio
P/E is often used for relative valuation since earnings power is a chief driver of investment value. By comparing a stock’s price per share to its earnings per share, we are able to see how much investors are paying for each pound of the company’s earnings.
P/E Calculation for SAGA
Price-Earnings Ratio = Price per share ÷ Earnings per share
SAGA Price-Earnings Ratio = £1.25 ÷ £0.13 = 9.6x
The P/E ratio isn’t a metric you view in isolation and only becomes useful when you compare it against other similar companies. We want to compare the stock’s P/E ratio to the average of companies that have similar characteristics as SAGA, such as size and country of operation. A quick method of creating a peer group is to use companies in the same industry, which is what I will do. SAGA’s P/E of 9.6x is lower than its industry peers (16.4x), which implies that each dollar of SAGA’s earnings is being undervalued by investors. Therefore, according to this analysis, SAGA is an under-priced stock.
Assumptions to watch out for
Before you jump to the conclusion that SAGA is the perfect buying opportunity, it is important to realise that our conclusion rests on two assertions. Firstly, our peer group contains companies that are similar to SAGA. If this isn’t the case, the difference in P/E could be due to other factors. For example, if you are comparing lower risk firms with SAGA, then its P/E would naturally be lower than its peers, as investors would value those with lower risk at a higher price. The second assumption that must hold true is that the stocks we are comparing SAGA to are fairly valued by the market. If this is violated, SAGA’s P/E may be lower than its peers as they are actually overvalued by investors.
What this means for you:
If your personal research into the stock confirms what the P/E ratio is telling you, it might be a good time to add more of SAGA to your portfolio. But keep in mind that the usefulness of relative valuation depends on whether you are comfortable with making the assumptions I mentioned above. Remember that basing your investment decision off one metric alone is certainly not sufficient. There are many things I have not taken into account in this article and the PE ratio is very one-dimensional. If you have not done so already, I urge you to complete your research by taking a look at the following:
Future Outlook: What are well-informed industry analysts predicting for SAGA’s future growth? Take a look at our free research report of analyst consensus for SAGA’s outlook.
Past Track Record: Has SAGA been consistently performing well irrespective of the ups and downs in the market? Go into more detail in the past performance analysis and take a look at the free visual representations of SAGA’s historicals for more clarity.
Other High-Performing Stocks: Are there other stocks that provide better prospects with proven track records? Explore our free list of these great stocks here.
To help readers see pass the short term volatility of the financial market, we aim to bring you a long-term focused research analysis purely driven by fundamental data. Note that our analysis does not factor in the latest price sensitive company announcements.
The author is an independent contributor and at the time of publication had no position in the stocks mentioned.
