
 Yahoo Finance
 salesforce.com, inc. (NYSE:CRM): Financial Strength Analysis

Want to participate in a short research study? Help shape the future of investing tools and you could win a $250 gift card!
With a market capitalization of US$116b, salesforce.com, inc. (NYSE:CRM) is a large-cap stock, which is considered by most investors as a safe bet. Common characteristics for these big stocks are their strong balance sheet and high liquidity, which means there's plenty of stocks available to the public for trading. In times of low liquidity in the market, these firms won’t be left high and dry. They are also relatively unaffected by increases in interest rates. Assessing the most recent data for CRM, I will take you through the key ratios to measure financial health, in particular, its solvency and liquidity.
View our latest analysis for salesforce.com
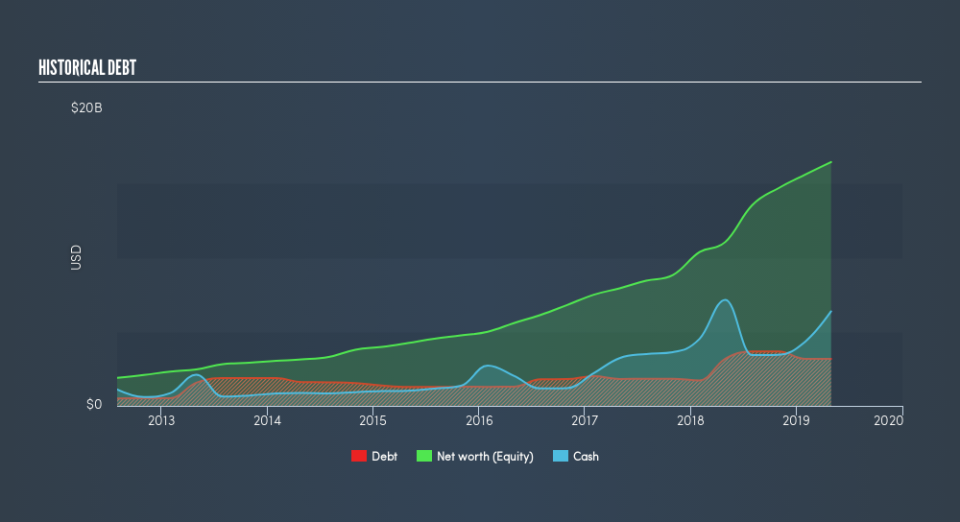
Does CRM Produce Much Cash Relative To Its Debt?
CRM has built up its total debt levels in the last twelve months, from US$4.0b to US$6.8b – this includes long-term debt. With this increase in debt, CRM's cash and short-term investments stands at US$6.4b , ready to be used for running the business. On top of this, CRM has produced US$3.9b in operating cash flow over the same time period, leading to an operating cash to total debt ratio of 58%, indicating that CRM’s debt is appropriately covered by operating cash.
Can CRM pay its short-term liabilities?
Looking at CRM’s US$10b in current liabilities, it seems that the business may not have an easy time meeting these commitments with a current assets level of US$10b, leading to a current ratio of 0.96x. The current ratio is calculated by dividing current assets by current liabilities.
Is CRM’s debt level acceptable?
With a debt-to-equity ratio of 23%, CRM's debt level may be seen as prudent. This range is considered safe as CRM is not taking on too much debt obligation, which can be restrictive and risky for equity-holders. We can check to see whether CRM is able to meet its debt obligations by looking at the net interest coverage ratio. A company generating earnings before interest and tax (EBIT) at least three times its net interest payments is considered financially sound. For CRM, the ratio of 6.6x suggests that interest is well-covered. Large-cap investments like CRM are often believed to be a safe investment due to their ability to pump out ample earnings multiple times its interest payments.
Next Steps:
CRM has demonstrated its ability to generate sufficient levels of cash flow, while its debt hovers at an appropriate level. But, its lack of liquidity raises questions over current asset management practices for the large-cap. I admit this is a fairly basic analysis for CRM's financial health. Other important fundamentals need to be considered alongside. I recommend you continue to research salesforce.com to get a better picture of the stock by looking at:
Future Outlook: What are well-informed industry analysts predicting for CRM’s future growth? Take a look at our free research report of analyst consensus for CRM’s outlook.
Valuation: What is CRM worth today? Is the stock undervalued, even when its growth outlook is factored into its intrinsic value? The intrinsic value infographic in our free research report helps visualize whether CRM is currently mispriced by the market.
Other High-Performing Stocks: Are there other stocks that provide better prospects with proven track records? Explore our free list of these great stocks here.
We aim to bring you long-term focused research analysis driven by fundamental data. Note that our analysis may not factor in the latest price-sensitive company announcements or qualitative material.
If you spot an error that warrants correction, please contact the editor at editorial-team@simplywallst.com. This article by Simply Wall St is general in nature. It does not constitute a recommendation to buy or sell any stock, and does not take account of your objectives, or your financial situation. Simply Wall St has no position in the stocks mentioned. Thank you for reading.
