
 Yahoo Finance
 Salmond inquiry: Scotland’s leadership has ‘failed,’ says former first minister in opening remarks
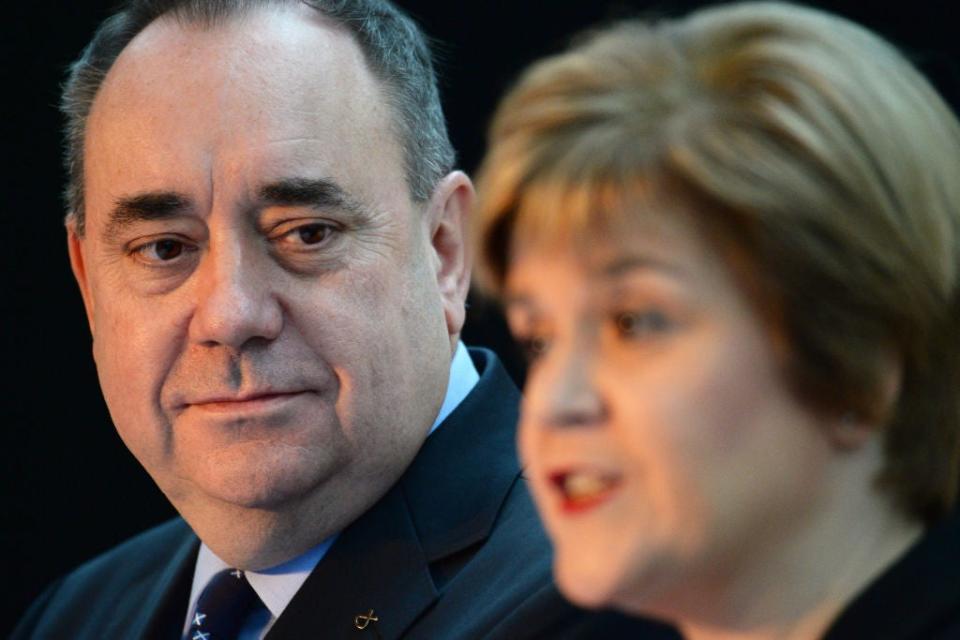
Scotland’s leadership has failed, Alex Salmond has claimed, as he told MSPs there had been a “calculated and deliberate suppression of key evidence” to a Holyrood committee.
Mr Salmond used his opening remarks at a highly-anticipated Scottish Parliament hearing to hit out at his successor, and former close ally, Nicola Sturgeon.
His evidence comes just days after he accused other former SNP allies of a ‘malicious’ effort to damage him and remove him from public life.
MSPs are investigating the Scottish government’s handling of harassment allegations against the ex-SNP leader, which saw him awarded £512,000.
Setting out his position, Mr Salmond accused Ms Sturgeon of using her daily Covid press conference on Wednesday “to effectively question the result of a jury”.
He said he “watched with astonishment” her remarks on his 2020 trial, in which he was cleared of sexually assaulting nine women.
Ms Sturgeon said on Wednesday: “The behaviour they complained of was found by a jury not to constitute criminal conduct, and Alex Salmond is innocent of criminality.
“But that doesn’t mean that the behaviour they claimed of didn’t happen, and I think it’s important that we don’t lose sight of that.”
Mr Salmond claimed the committee he was appearing before had been asked to do its job "with both hands tied behind its back and a blindfold on".
He added: "Scotland hasn’t failed, its leadership has failed.
"The importance of this inquiry is for each and everyone of us to help put this right.”
Mr Salmond has initially been due to give his evidence on Wednesday.
But he dramatically pulled out of that appearance at the eleventh hour amid an extraordinary row over a written submission he made to the committee.
This was initially published by the Scottish Parliament on its website earlier this week.
But in a shock development, it was later removed and part of the evidence redacted.
It was then republished on the website, despite the original document being in the public domain for at least 16 hours.
The row was prompted by an intervention from the Crown Office, which oversees the prosecution of crime in Scotland and which expressed concerns over Mr Salmond’s submission.
In a series of damaging allegations Mr Salmond said there had been “obstruction of justice” as Scottish government documents had been improperly withheld from the courts.
He also said that if Ms Sturgeon had been aware that her government was about to lose its case against him, and had proceeded anyway, that would mean the first minister had breached the ministerial code.
The legal advice received by the Scottish government has not been published.
Read More
Nicola Sturgeon’s husband should be ‘removed’ as SNP chief executive, says Salmond ally
Sturgeon: I have no regrets about allowing investigation into Salmond complaints
Alex Salmond believes ‘conspiracy’ was aimed at stopping his political comeback, claims ally
