
 Yahoo Finance
 The Salvatore Ferragamo (BIT:SFER) Share Price Is Down 26% So Some Shareholders Are Getting Worried

As an investor its worth striving to ensure your overall portfolio beats the market average. But if you try your hand at stock picking, your risk returning less than the market. Unfortunately, that's been the case for longer term Salvatore Ferragamo S.p.A. (BIT:SFER) shareholders, since the share price is down 26% in the last three years, falling well short of the market return of around 32%. The falls have accelerated recently, with the share price down 22% in the last three months.
See our latest analysis for Salvatore Ferragamo
There is no denying that markets are sometimes efficient, but prices do not always reflect underlying business performance. One way to examine how market sentiment has changed over time is to look at the interaction between a company's share price and its earnings per share (EPS).
During the three years that the share price fell, Salvatore Ferragamo's earnings per share (EPS) dropped by 20% each year. In comparison the 9.6% compound annual share price decline isn't as bad as the EPS drop-off. This suggests that the market retains some optimism around long term earnings stability, despite past EPS declines.
You can see below how EPS has changed over time (discover the exact values by clicking on the image).
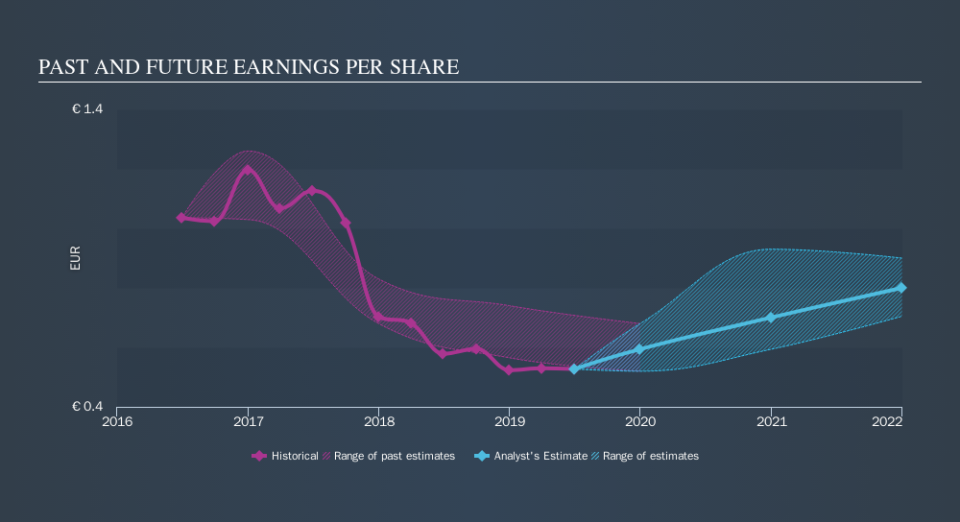
Dive deeper into Salvatore Ferragamo's key metrics by checking this interactive graph of Salvatore Ferragamo's earnings, revenue and cash flow.
What About Dividends?
It is important to consider the total shareholder return, as well as the share price return, for any given stock. The TSR is a return calculation that accounts for the value of cash dividends (assuming that any dividend received was reinvested) and the calculated value of any discounted capital raisings and spin-offs. Arguably, the TSR gives a more comprehensive picture of the return generated by a stock. As it happens, Salvatore Ferragamo's TSR for the last 3 years was -23%, which exceeds the share price return mentioned earlier. This is largely a result of its dividend payments!
A Different Perspective
While the broader market gained around 7.8% in the last year, Salvatore Ferragamo shareholders lost 15% (even including dividends) . However, keep in mind that even the best stocks will sometimes underperform the market over a twelve month period. Regrettably, last year's performance caps off a bad run, with the shareholders facing a total loss of 2.7% per year over five years. Generally speaking long term share price weakness can be a bad sign, though contrarian investors might want to research the stock in hope of a turnaround. Is Salvatore Ferragamo cheap compared to other companies? These 3 valuation measures might help you decide.
But note: Salvatore Ferragamo may not be the best stock to buy. So take a peek at this free list of interesting companies with past earnings growth (and further growth forecast).
Please note, the market returns quoted in this article reflect the market weighted average returns of stocks that currently trade on IT exchanges.
We aim to bring you long-term focused research analysis driven by fundamental data. Note that our analysis may not factor in the latest price-sensitive company announcements or qualitative material.
If you spot an error that warrants correction, please contact the editor at editorial-team@simplywallst.com. This article by Simply Wall St is general in nature. It does not constitute a recommendation to buy or sell any stock, and does not take account of your objectives, or your financial situation. Simply Wall St has no position in the stocks mentioned. Thank you for reading.
