
 Yahoo Finance
 With Savannah Energy PLC (LON:SAVE) It Looks Like You'll Get What You Pay For
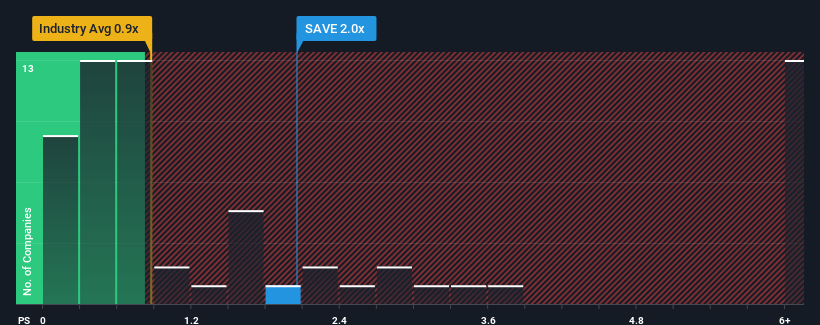
When you see that almost half of the companies in the Oil and Gas industry in the United Kingdom have price-to-sales ratios (or "P/S") below 0.9x, Savannah Energy PLC (LON:SAVE) looks to be giving off some sell signals with its 2x P/S ratio. Nonetheless, we'd need to dig a little deeper to determine if there is a rational basis for the elevated P/S.
See our latest analysis for Savannah Energy
What Does Savannah Energy's P/S Mean For Shareholders?
Recent times haven't been great for Savannah Energy as its revenue has been rising slower than most other companies. Perhaps the market is expecting future revenue performance to undergo a reversal of fortunes, which has elevated the P/S ratio. However, if this isn't the case, investors might get caught out paying too much for the stock.
Keen to find out how analysts think Savannah Energy's future stacks up against the industry? In that case, our free report is a great place to start.
How Is Savannah Energy's Revenue Growth Trending?
There's an inherent assumption that a company should outperform the industry for P/S ratios like Savannah Energy's to be considered reasonable.
Retrospectively, the last year delivered a decent 14% gain to the company's revenues. Spectacularly, three year revenue growth has ballooned by several orders of magnitude, even though the last 12 months were fairly tame in comparison. Accordingly, shareholders would have been over the moon with those medium-term rates of revenue growth.
Turning to the outlook, the next year should demonstrate the company's robustness, generating growth of 70% as estimated by the only analyst watching the company. With the rest of the industry predicted to shrink by 10%, that would be a fantastic result.
With this in consideration, we understand why Savannah Energy's P/S is a cut above its industry peers. Right now, investors are willing to pay more for a stock that is shaping up to buck the trend of the broader industry going backwards.
The Bottom Line On Savannah Energy's P/S
It's argued the price-to-sales ratio is an inferior measure of value within certain industries, but it can be a powerful business sentiment indicator.
We can see that Savannah Energy maintains its high P/S on the strength of its forecast growth potentially beating a struggling industry, as expected. At this stage investors feel the potential for a deterioration in revenue is remote enough to justify paying a premium in the form of a high P/S. Our only concern is whether its revenue trajectory can keep outperforming under these tough industry conditions. Although, if the company's prospects don't change they will continue to provide strong support to the share price.
Before you settle on your opinion, we've discovered 1 warning sign for Savannah Energy that you should be aware of.
If you're unsure about the strength of Savannah Energy's business, why not explore our interactive list of stocks with solid business fundamentals for some other companies you may have missed.
Have feedback on this article? Concerned about the content? Get in touch with us directly. Alternatively, email editorial-team (at) simplywallst.com.
This article by Simply Wall St is general in nature. We provide commentary based on historical data and analyst forecasts only using an unbiased methodology and our articles are not intended to be financial advice. It does not constitute a recommendation to buy or sell any stock, and does not take account of your objectives, or your financial situation. We aim to bring you long-term focused analysis driven by fundamental data. Note that our analysis may not factor in the latest price-sensitive company announcements or qualitative material. Simply Wall St has no position in any stocks mentioned.
Join A Paid User Research Session
You’ll receive a US$30 Amazon Gift card for 1 hour of your time while helping us build better investing tools for the individual investors like yourself. Sign up here
