
 Yahoo Finance
 Is Savills plc (LON:SVS) A Volatile Stock?

Want to participate in a research study? Help shape the future of investing tools and earn a $60 gift card!
Anyone researching Savills plc (LON:SVS) might want to consider the historical volatility of the share price. Modern finance theory considers volatility to be a measure of risk, and there are two main types of price volatility. First, we have company specific volatility, which is the price gyrations of an individual stock. Holding at least 8 stocks can reduce this kind of risk across a portfolio. The second type is the broader market volatility, which you cannot diversify away, since it arises from macroeconomic factors which directly affects all the stocks on the market.
Some stocks see their prices move in concert with the market. Others tend towards stronger, gentler or unrelated price movements. Some investors use beta as a measure of how much a certain stock is impacted by market risk (volatility). While we should keep in mind that Warren Buffett has cautioned that 'Volatility is far from synonymous with risk', beta is still a useful factor to consider. To make good use of it you must first know that the beta of the overall market is one. A stock with a beta greater than one is more sensitive to broader market movements than a stock with a beta of less than one.
View our latest analysis for Savills
What we can learn from SVS's beta value
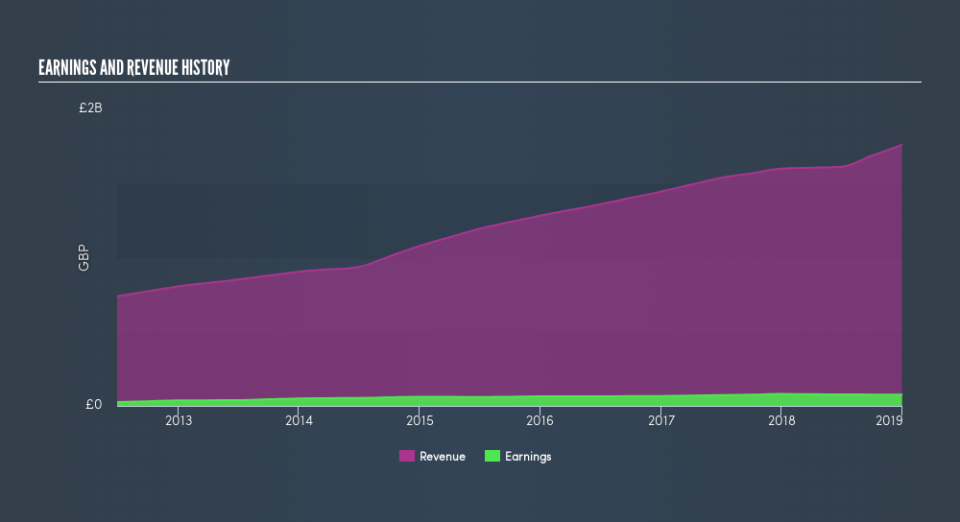
Given that it has a beta of 1.17, we can surmise that the Savills share price has been fairly sensitive to market volatility (over the last 5 years). Based on this history, investors should be aware that Savills are likely to rise strongly in times of greed, but sell off in times of fear. Share price volatility is well worth considering, but most long term investors consider the history of revenue and earnings growth to be more important. Take a look at how Savills fares in that regard, below.
Does SVS's size influence the expected beta?
With a market capitalisation of UK£1.2b, Savills is a small cap stock. However, it is big enough to catch the attention of professional investors. It's not particularly surprising that it has a higher beta than the overall market. That's because it takes less money to influence the share price of a smaller company, than a bigger company.
What this means for you:
Since Savills tends to moves up when the market is going up, and down when it's going down, potential investors may wish to reflect on the overall market, when considering the stock. This article aims to educate investors about beta values, but it's well worth looking at important company-specific fundamentals such as Savills’s financial health and performance track record. I highly recommend you dive deeper by considering the following:
Future Outlook: What are well-informed industry analysts predicting for SVS’s future growth? Take a look at our free research report of analyst consensus for SVS’s outlook.
Past Track Record: Has SVS been consistently performing well irrespective of the ups and downs in the market? Go into more detail in the past performance analysis and take a look at the free visual representations of SVS's historicals for more clarity.
Other Interesting Stocks: It's worth checking to see how SVS measures up against other companies on valuation. You could start with this free list of prospective options.
We aim to bring you long-term focused research analysis driven by fundamental data. Note that our analysis may not factor in the latest price-sensitive company announcements or qualitative material.
If you spot an error that warrants correction, please contact the editor at editorial-team@simplywallst.com. This article by Simply Wall St is general in nature. It does not constitute a recommendation to buy or sell any stock, and does not take account of your objectives, or your financial situation. Simply Wall St has no position in the stocks mentioned. Thank you for reading.
