
 Yahoo Finance
 SBM Offshore (AMS:SBMO) shareholders YoY returns are lagging the company's 4.0% five-year earnings growth
While not a mind-blowing move, it is good to see that the SBM Offshore N.V. (AMS:SBMO) share price has gained 14% in the last three months. But if you look at the last five years the returns have not been good. In fact, the share price is down 19%, which falls well short of the return you could get by buying an index fund.
After losing 3.6% this past week, it's worth investigating the company's fundamentals to see what we can infer from past performance.
Check out our latest analysis for SBM Offshore
While the efficient markets hypothesis continues to be taught by some, it has been proven that markets are over-reactive dynamic systems, and investors are not always rational. One flawed but reasonable way to assess how sentiment around a company has changed is to compare the earnings per share (EPS) with the share price.
While the share price declined over five years, SBM Offshore actually managed to increase EPS by an average of 22% per year. Given the share price reaction, one might suspect that EPS is not a good guide to the business performance during the period (perhaps due to a one-off loss or gain). Alternatively, growth expectations may have been unreasonable in the past.
It is unusual to see such modest share price growth in the face of sustained EPS improvements. We can look to other metrics to try to understand the situation better.
We note that the dividend has remained healthy, so that wouldn't really explain the share price drop. While it's not completely obvious why the share price is down, a closer look at the company's history might help explain it.
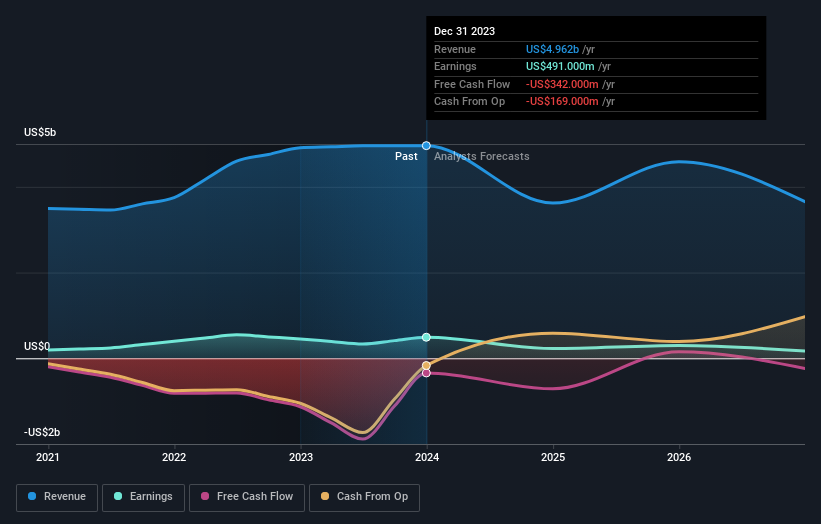
The image below shows how earnings and revenue have tracked over time (if you click on the image you can see greater detail).
We know that SBM Offshore has improved its bottom line over the last three years, but what does the future have in store? If you are thinking of buying or selling SBM Offshore stock, you should check out this FREE detailed report on its balance sheet.
What About Dividends?
As well as measuring the share price return, investors should also consider the total shareholder return (TSR). The TSR incorporates the value of any spin-offs or discounted capital raisings, along with any dividends, based on the assumption that the dividends are reinvested. It's fair to say that the TSR gives a more complete picture for stocks that pay a dividend. As it happens, SBM Offshore's TSR for the last 5 years was 8.6%, which exceeds the share price return mentioned earlier. The dividends paid by the company have thusly boosted the total shareholder return.
A Different Perspective
SBM Offshore provided a TSR of 9.1% over the last twelve months. But that return falls short of the market. On the bright side, that's still a gain, and it's actually better than the average return of 1.7% over half a decade This could indicate that the company is winning over new investors, as it pursues its strategy. While it is well worth considering the different impacts that market conditions can have on the share price, there are other factors that are even more important. For instance, we've identified 3 warning signs for SBM Offshore (2 are concerning) that you should be aware of.
If you are like me, then you will not want to miss this free list of growing companies that insiders are buying.
Please note, the market returns quoted in this article reflect the market weighted average returns of stocks that currently trade on Dutch exchanges.
Have feedback on this article? Concerned about the content? Get in touch with us directly. Alternatively, email editorial-team (at) simplywallst.com.
This article by Simply Wall St is general in nature. We provide commentary based on historical data and analyst forecasts only using an unbiased methodology and our articles are not intended to be financial advice. It does not constitute a recommendation to buy or sell any stock, and does not take account of your objectives, or your financial situation. We aim to bring you long-term focused analysis driven by fundamental data. Note that our analysis may not factor in the latest price-sensitive company announcements or qualitative material. Simply Wall St has no position in any stocks mentioned.
