
 Yahoo Finance
 SBM Offshore's (AMS:SBMO) investors will be pleased with their 3.0% return over the last three years
SBM Offshore N.V. (AMS:SBMO) shareholders should be happy to see the share price up 10% in the last quarter. But that doesn't change the fact that the returns over the last three years have been less than pleasing. Truth be told the share price declined 13% in three years and that return, Dear Reader, falls short of what you could have got from passive investing with an index fund.
With that in mind, it's worth seeing if the company's underlying fundamentals have been the driver of long term performance, or if there are some discrepancies.
Check out our latest analysis for SBM Offshore
To paraphrase Benjamin Graham: Over the short term the market is a voting machine, but over the long term it's a weighing machine. One imperfect but simple way to consider how the market perception of a company has shifted is to compare the change in the earnings per share (EPS) with the share price movement.
Although the share price is down over three years, SBM Offshore actually managed to grow EPS by 48% per year in that time. Given the share price reaction, one might suspect that EPS is not a good guide to the business performance during the period (perhaps due to a one-off loss or gain). Alternatively, growth expectations may have been unreasonable in the past.
It is a little bizarre to see the share price down, despite a strong improvement to earnings per share. Therefore, we should look at some other metrics to try to understand why the market is disappointed.
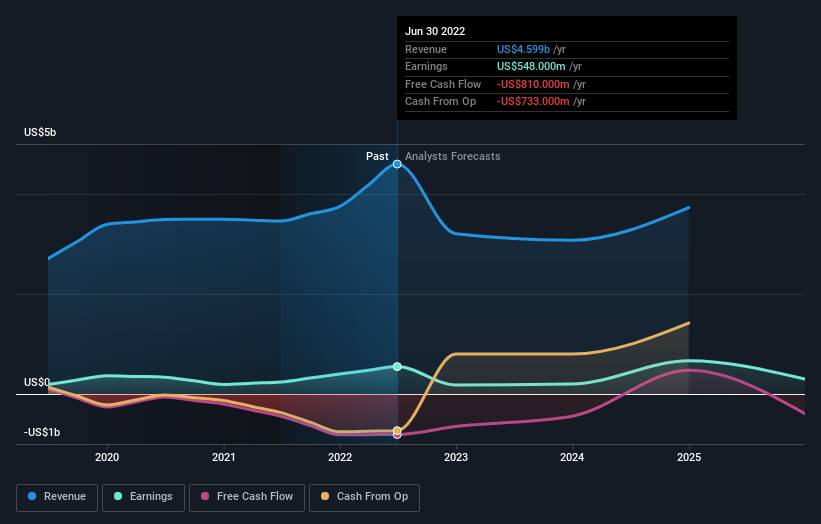
We note that the dividend seems healthy enough, so that probably doesn't explain the share price drop. We like that SBM Offshore has actually grown its revenue over the last three years. If the company can keep growing revenue, there may be an opportunity for investors. You might have to dig deeper to understand the recent share price weakness.
You can see below how earnings and revenue have changed over time (discover the exact values by clicking on the image).
We know that SBM Offshore has improved its bottom line over the last three years, but what does the future have in store? If you are thinking of buying or selling SBM Offshore stock, you should check out this FREE detailed report on its balance sheet.
What About Dividends?
It is important to consider the total shareholder return, as well as the share price return, for any given stock. The TSR is a return calculation that accounts for the value of cash dividends (assuming that any dividend received was reinvested) and the calculated value of any discounted capital raisings and spin-offs. Arguably, the TSR gives a more comprehensive picture of the return generated by a stock. We note that for SBM Offshore the TSR over the last 3 years was 3.0%, which is better than the share price return mentioned above. The dividends paid by the company have thusly boosted the total shareholder return.
A Different Perspective
We're pleased to report that SBM Offshore shareholders have received a total shareholder return of 8.2% over one year. And that does include the dividend. That gain is better than the annual TSR over five years, which is 3%. Therefore it seems like sentiment around the company has been positive lately. Given the share price momentum remains strong, it might be worth taking a closer look at the stock, lest you miss an opportunity. I find it very interesting to look at share price over the long term as a proxy for business performance. But to truly gain insight, we need to consider other information, too. For instance, we've identified 2 warning signs for SBM Offshore (1 shouldn't be ignored) that you should be aware of.
If you would prefer to check out another company -- one with potentially superior financials -- then do not miss this free list of companies that have proven they can grow earnings.
Please note, the market returns quoted in this article reflect the market weighted average returns of stocks that currently trade on NL exchanges.
Have feedback on this article? Concerned about the content? Get in touch with us directly. Alternatively, email editorial-team (at) simplywallst.com.
This article by Simply Wall St is general in nature. We provide commentary based on historical data and analyst forecasts only using an unbiased methodology and our articles are not intended to be financial advice. It does not constitute a recommendation to buy or sell any stock, and does not take account of your objectives, or your financial situation. We aim to bring you long-term focused analysis driven by fundamental data. Note that our analysis may not factor in the latest price-sensitive company announcements or qualitative material. Simply Wall St has no position in any stocks mentioned.
Join A Paid User Research Session
You’ll receive a US$30 Amazon Gift card for 1 hour of your time while helping us build better investing tools for the individual investors like yourself. Sign up here
