
 Yahoo Finance
 Schneider National (NYSE:SNDR) stock performs better than its underlying earnings growth over last five years
While Schneider National, Inc. (NYSE:SNDR) shareholders are probably generally happy, the stock hasn't had particularly good run recently, with the share price falling 16% in the last quarter. On the bright side the share price is up over the last half decade. In that time, it is up 16%, which isn't bad, but is below the market return of 102%.
After a strong gain in the past week, it's worth seeing if longer term returns have been driven by improving fundamentals.
See our latest analysis for Schneider National
In his essay The Superinvestors of Graham-and-Doddsville Warren Buffett described how share prices do not always rationally reflect the value of a business. One way to examine how market sentiment has changed over time is to look at the interaction between a company's share price and its earnings per share (EPS).
Over half a decade, Schneider National managed to grow its earnings per share at 18% a year. The EPS growth is more impressive than the yearly share price gain of 3% over the same period. So it seems the market isn't so enthusiastic about the stock these days. This cautious sentiment is reflected in its (fairly low) P/E ratio of 9.76.
The graphic below depicts how EPS has changed over time (unveil the exact values by clicking on the image).
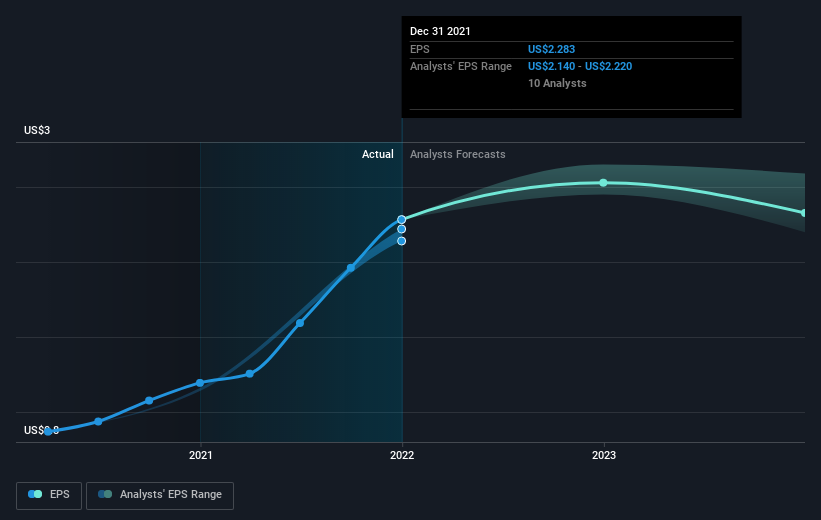
We know that Schneider National has improved its bottom line lately, but is it going to grow revenue? You could check out this free report showing analyst revenue forecasts.
What About Dividends?
As well as measuring the share price return, investors should also consider the total shareholder return (TSR). The TSR incorporates the value of any spin-offs or discounted capital raisings, along with any dividends, based on the assumption that the dividends are reinvested. So for companies that pay a generous dividend, the TSR is often a lot higher than the share price return. In the case of Schneider National, it has a TSR of 34% for the last 5 years. That exceeds its share price return that we previously mentioned. This is largely a result of its dividend payments!
A Different Perspective
While the broader market gained around 2.1% in the last year, Schneider National shareholders lost 10% (even including dividends). Even the share prices of good stocks drop sometimes, but we want to see improvements in the fundamental metrics of a business, before getting too interested. On the bright side, long term shareholders have made money, with a gain of 6% per year over half a decade. It could be that the recent sell-off is an opportunity, so it may be worth checking the fundamental data for signs of a long term growth trend. Before forming an opinion on Schneider National you might want to consider these 3 valuation metrics.
If you would prefer to check out another company -- one with potentially superior financials -- then do not miss this free list of companies that have proven they can grow earnings.
Please note, the market returns quoted in this article reflect the market weighted average returns of stocks that currently trade on US exchanges.
Have feedback on this article? Concerned about the content? Get in touch with us directly. Alternatively, email editorial-team (at) simplywallst.com.
This article by Simply Wall St is general in nature. We provide commentary based on historical data and analyst forecasts only using an unbiased methodology and our articles are not intended to be financial advice. It does not constitute a recommendation to buy or sell any stock, and does not take account of your objectives, or your financial situation. We aim to bring you long-term focused analysis driven by fundamental data. Note that our analysis may not factor in the latest price-sensitive company announcements or qualitative material. Simply Wall St has no position in any stocks mentioned.
