
 Yahoo Finance
 Science in Sport plc (LON:SIS) Might Not Be As Mispriced As It Looks
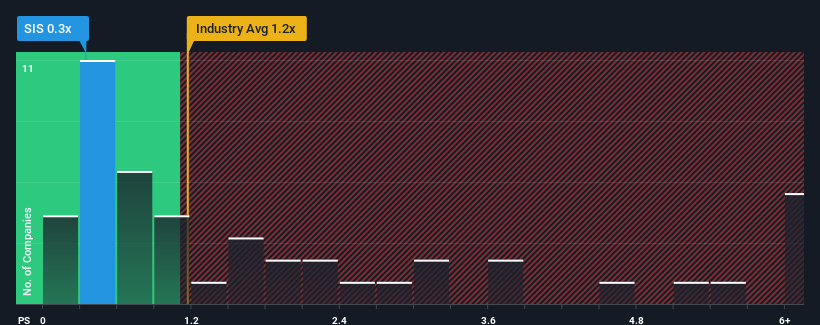
Science in Sport plc's (LON:SIS) price-to-sales (or "P/S") ratio of 0.3x might make it look like a buy right now compared to the Personal Products industry in the United Kingdom, where around half of the companies have P/S ratios above 2x and even P/S above 6x are quite common. However, the P/S might be low for a reason and it requires further investigation to determine if it's justified.
View our latest analysis for Science in Sport
How Has Science in Sport Performed Recently?
Science in Sport could be doing better as it's been growing revenue less than most other companies lately. The P/S ratio is probably low because investors think this lacklustre revenue performance isn't going to get any better. If this is the case, then existing shareholders will probably struggle to get excited about the future direction of the share price.
Keen to find out how analysts think Science in Sport's future stacks up against the industry? In that case, our free report is a great place to start.
What Are Revenue Growth Metrics Telling Us About The Low P/S?
Science in Sport's P/S ratio would be typical for a company that's only expected to deliver limited growth, and importantly, perform worse than the industry.
Retrospectively, the last year delivered virtually the same number to the company's top line as the year before. Still, the latest three year period was better as it's delivered a decent 26% overall rise in revenue. Therefore, it's fair to say that revenue growth has been inconsistent recently for the company.
Shifting to the future, estimates from the one analyst covering the company suggest revenue should grow by 13% per year over the next three years. With the industry only predicted to deliver 2.9% per annum, the company is positioned for a stronger revenue result.
With this in consideration, we find it intriguing that Science in Sport's P/S sits behind most of its industry peers. Apparently some shareholders are doubtful of the forecasts and have been accepting significantly lower selling prices.
What Does Science in Sport's P/S Mean For Investors?
Using the price-to-sales ratio alone to determine if you should sell your stock isn't sensible, however it can be a practical guide to the company's future prospects.
A look at Science in Sport's revenues reveals that, despite glowing future growth forecasts, its P/S is much lower than we'd expect. When we see strong growth forecasts like this, we can only assume potential risks are what might be placing significant pressure on the P/S ratio. While the possibility of the share price plunging seems unlikely due to the high growth forecasted for the company, the market does appear to have some hesitation.
Plus, you should also learn about these 4 warning signs we've spotted with Science in Sport (including 1 which is a bit unpleasant).
If you're unsure about the strength of Science in Sport's business, why not explore our interactive list of stocks with solid business fundamentals for some other companies you may have missed.
Have feedback on this article? Concerned about the content? Get in touch with us directly. Alternatively, email editorial-team (at) simplywallst.com.
This article by Simply Wall St is general in nature. We provide commentary based on historical data and analyst forecasts only using an unbiased methodology and our articles are not intended to be financial advice. It does not constitute a recommendation to buy or sell any stock, and does not take account of your objectives, or your financial situation. We aim to bring you long-term focused analysis driven by fundamental data. Note that our analysis may not factor in the latest price-sensitive company announcements or qualitative material. Simply Wall St has no position in any stocks mentioned.
