
 Yahoo Finance
 Secure Income REIT's (LON:SIR) Stock Price Has Reduced 32% In The Past Year
The simplest way to benefit from a rising market is to buy an index fund. When you buy individual stocks, you can make higher profits, but you also face the risk of under-performance. Unfortunately the Secure Income REIT Plc (LON:SIR) share price slid 32% over twelve months. That falls noticeably short of the market decline of around 7.1%. At least the damage isn't so bad if you look at the last three years, since the stock is down 19% in that time.
Check out our latest analysis for Secure Income REIT
While the efficient markets hypothesis continues to be taught by some, it has been proven that markets are over-reactive dynamic systems, and investors are not always rational. By comparing earnings per share (EPS) and share price changes over time, we can get a feel for how investor attitudes to a company have morphed over time.
During the last year Secure Income REIT saw its earnings per share drop below zero. Buyers no doubt think it's a temporary situation, but those with a nose for quality have low tolerance for losses. Of course, if the company can turn the situation around, investors will likely profit.
The image below shows how EPS has tracked over time (if you click on the image you can see greater detail).
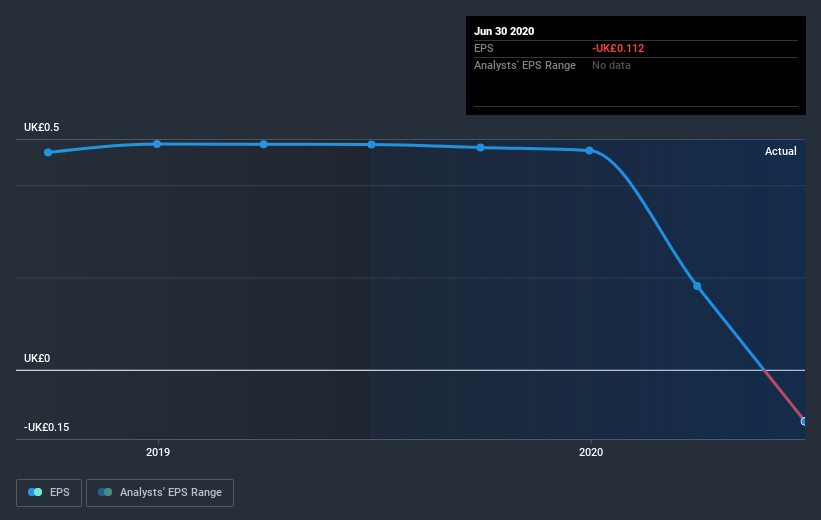
Dive deeper into Secure Income REIT's key metrics by checking this interactive graph of Secure Income REIT's earnings, revenue and cash flow.
What About Dividends?
When looking at investment returns, it is important to consider the difference between total shareholder return (TSR) and share price return. The TSR incorporates the value of any spin-offs or discounted capital raisings, along with any dividends, based on the assumption that the dividends are reinvested. It's fair to say that the TSR gives a more complete picture for stocks that pay a dividend. As it happens, Secure Income REIT's TSR for the last year was -29%, which exceeds the share price return mentioned earlier. And there's no prize for guessing that the dividend payments largely explain the divergence!
A Different Perspective
We regret to report that Secure Income REIT shareholders are down 29% for the year (even including dividends). Unfortunately, that's worse than the broader market decline of 7.1%. Having said that, it's inevitable that some stocks will be oversold in a falling market. The key is to keep your eyes on the fundamental developments. On the bright side, long term shareholders have made money, with a gain of 7% per year over half a decade. It could be that the recent sell-off is an opportunity, so it may be worth checking the fundamental data for signs of a long term growth trend. It's always interesting to track share price performance over the longer term. But to understand Secure Income REIT better, we need to consider many other factors. Even so, be aware that Secure Income REIT is showing 2 warning signs in our investment analysis , and 1 of those is a bit unpleasant...
But note: Secure Income REIT may not be the best stock to buy. So take a peek at this free list of interesting companies with past earnings growth (and further growth forecast).
Please note, the market returns quoted in this article reflect the market weighted average returns of stocks that currently trade on GB exchanges.
This article by Simply Wall St is general in nature. It does not constitute a recommendation to buy or sell any stock, and does not take account of your objectives, or your financial situation. We aim to bring you long-term focused analysis driven by fundamental data. Note that our analysis may not factor in the latest price-sensitive company announcements or qualitative material. Simply Wall St has no position in any stocks mentioned.
Have feedback on this article? Concerned about the content? Get in touch with us directly. Alternatively, email editorial-team@simplywallst.com.
