Semtech (SMTC) Earnings & Revenues Beat Estimates in Q3
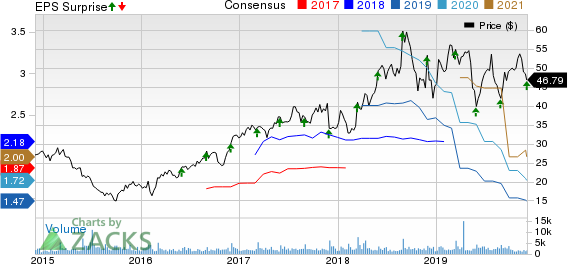
Semtech Corporation’s SMTC fiscal third-quarter 2020 non-GAAP earnings of 41 cents per share surpassed the Zacks Consensus Estimate by a couple of cents. The reported earnings increased 7.9% sequentially but decreased 34.9% year over year.
Non-GAAP revenues of $141.01 million increased 2.8% sequentially but decreased 18.7% from the prior-year quarter. The sequential increase was driven by growth in IoT and hyper scale data center markets.
Revenues surpassed the Zacks Consensus Estimate by 0.8% and came within the guided range of $135-$145 million.
Its key growth drivers are product differentiation, operational flexibility, and specific focus on fast-growing segments and regions.
Let’s delve into the numbers in detail:
Semtech Corporation Price, Consensus and EPS Surprise

Semtech Corporation price-consensus-eps-surprise-chart | Semtech Corporation Quote
Revenues by End Market
Sales to the enterprise computing end market — which represented 31% of its total revenues — increased 16% on a sequential basis, driven by a strong rebound in PON demand.
Also, industrial and communications end markets increased 2% and 1% sequentially, representing 34% and 10% of the total revenues, respectively. Revenues from the industrial market decreased, as growth from the LoRa business was offset by broad industrial weakness. This represented 34% of total net revenues.
Also, sales to the high-end consumer market represented 25% of total revenues. The figure decreased 3% sequentially due to lower smartphone demand. Roughly 16% of high-end consumer revenues were attributable to mobile devices and 9% to other consumer systems.
Revenues by Product Group
Signal Integrity Product Group revenues contributed 42% to total sales. The reported figure increased 6% sequentially. The increase was driven by strong demand from the hyperscale data center and PON segments, partially offset by weakness from the base station and broader industrial markets.
Revenues from Protection Product Group represented 28% of the total revenues. The figure was flat sequentially, driven by strength in the mobile business and increase in broad-based demand from industrial and automotive markets.
Revenues from Wireless and Sensing Product Group, which contributed 30% to total revenues, increased 1% sequentially.
Bookings
Bookings, which accounted for roughly 42% of shipments, decreased on a sequential basis during the quarter. The book-to-bill ratio was above 1.
Margins and Net Income
Non-GAAP gross margin was 61.6%, down 60 basis points (bps) sequentially and 10 bps from the year-ago quarter.
Semtech’s adjusted operating expenses of $52.9 million were down 2.6% on a year-over-year basis.
As a result, its operating margin of 24% was up 110 bps sequentially but down 640 bps year over year.
Balance Sheet & Cash Flow
Semtech ended the quarter with cash and cash equivalents of $283.1 million versus $287.8 million in the fiscal second quarter. Accounts receivables were $61.4 million, up from $58.6 million in the fiscal second quarter. Long-term debt was $179.1 million, down from $183.7 million in the fiscal second quarter.
During the quarter, cash flow from operations was $33.3 million, capital expenditure amounted to $3.5 million and free cash flow totaled $29.8 million.
Guidance
For fiscal fourth-quarter 2020, management expects revenues in the range of $130-$140 million. The corresponding Zacks Consensus Estimate for the quarter is pegged at $139.9 million.
Non-GAAP gross profit margin is expected within 61-62%. Management projects SG&A expenses within $28-$29 million, and research and development costs in the range of $24-$25 million. Non-GAAP earnings per share are expected in the range of 33-39 cents. The Zacks Consensus Estimate for the same is pegged at 39 cents.
Zacks Rank and Stocks to Consider
Semtech currently has a Zacks Rank #5 (Strong Sell). Some better-ranked stocks in the broader technology sector include MACOM Technology Solutions Holdings, Inc. MTSI, Itron, Inc. ITRI and AMETEK, Inc. AME, each carrying a Zacks Rank #2 (Buy). You can see the complete list of today’s Zacks #1 Rank (Strong Buy) stocks here.
Long-term earnings growth for MACOM Technology, Itron and AMETEK is currently projected at 15%, 25% and 10.9%, respectively.
More Stock News: This Is Bigger than the iPhone!
It could become the mother of all technological revolutions. Apple sold a mere 1 billion iPhones in 10 years but a new breakthrough is expected to generate more than 27 billion devices in just 3 years, creating a $1.7 trillion market.
Zacks has just released a Special Report that spotlights this fast-emerging phenomenon and 6 tickers for taking advantage of it. If you don't buy now, you may kick yourself in 2020.
Click here for the 6 trades >>
Want the latest recommendations from Zacks Investment Research? Today, you can download 7 Best Stocks for the Next 30 Days. Click to get this free report
Semtech Corporation (SMTC) : Free Stock Analysis Report
MACOM Technology Solutions Holdings, Inc. (MTSI) : Free Stock Analysis Report
AMETEK, Inc. (AME) : Free Stock Analysis Report
Itron, Inc. (ITRI) : Free Stock Analysis Report
To read this article on Zacks.com click here.
Zacks Investment Research

 Yahoo Finance