
 Yahoo Finance
 Semtech (SMTC) Earnings & Revenues Beat Estimates in Q2
Semtech Corporation’s SMTC fiscal second-quarter 2020 non-GAAP earnings of 38 cents per share surpassed the Zacks Consensus Estimate by a couple of cents. The reported earnings increased 11.8% sequentially but decreased 30.9% year over year.
Non-GAAP revenues of $137.1 million increased 4.4% sequentially but decreased 16% from the prior-year quarter. The sequential increase was driven by growth in IoT and hyper scale data center markets.
Revenues surpassed the Zacks Consensus Estimate by 1.78% and came within the guided range of $128-$142 million.
Its key growth drivers are product differentiation, operational flexibility, and specific focus on fast-growing segments and regions.
Semtech Corporation Price, Consensus and EPS Surprise
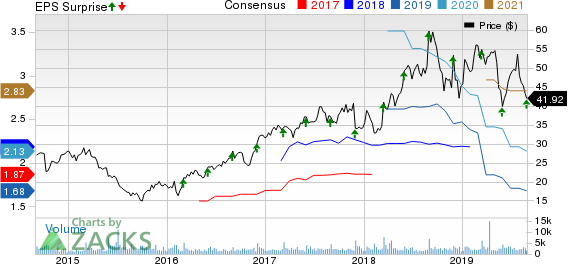
Semtech Corporation price-consensus-eps-surprise-chart | Semtech Corporation Quote
Let’s delve into the numbers in detail:
Revenues by End Market
Sales to the enterprise computing end market, which represented 27% of its total revenues, increased 4% on a sequential basis.
Also, industrial and communications end markets increased 24% and 4% sequentially, representing 36% and 10% of the total revenues, respectively. The industrial market was driven by strong growth from the LoRa business.
However, sales to the high-end consumer market represented 33% of total revenues, decreasing 15% sequentially due to lower smartphone demand. Roughly 16% of high-end consumer revenues were attributable to mobile devices and 11% to other consumer systems.
Revenues by Product Group
Signal Integrity Product Group revenues contributed 40% to total sales and increased 10% sequentially. The increase was driven by strength in data center and wireless space station markets. However, the PON market remained soft.
Revenues from Protection Product Group represented 29% of the total revenues and were up 4% sequentially, driven by increase in broad-based demand from industrial, automotive, and consumer markets.
Revenues from Wireless and Sensing Product Group, which contributed 30% to total revenues, were flat sequentially.
Bookings
Bookings, which accounted for roughly 41% of shipments, increased on a sequential basis during the quarter. The book-to-bill ratio was above 1.
Margins and Net Income
Non-GAAP gross margin was 62.2%, flat sequentially but up 70 basis points (bps) from the year-ago quarter.
Semtech’s adjusted operating expenses of $30.4 million were up 7.8% on a year-over-year basis and 5.9% sequentially.
As a result, its operating margin of 22.9% was up 110 bps sequentially but down 600 bps year over year.
Balance Sheet & Cash Flow
Semtech ended the quarter with cash and cash equivalents of $287.8 million versus $287.3 million in the fiscal first quarter. Accounts receivables were $58.6 million, down from $66.5 million in the fiscal first quarter. Long-term debt was $183.7 million, down from $188.3 million in the fiscal first quarter.
During the quarter, cash flow from operations was $33.4 million, capital expenditure amounted to $1.6 million and free cash flow totaled $31.7 million.
Guidance
For fiscal third-quarter 2020, management expects revenues in the range of $135-$145 million. The corresponding Zacks Consensus Estimate for the quarter is pegged at $149.5 million.
Non-GAAP gross profit margin is expected within 61.4-62%. Management projects SG&A expenses within $28-$29 million, and research and development costs in the range of $24-$25 million. Non-GAAP earnings per share are expected in the range of 38-42 cents. The Zacks Consensus Estimate for the same is pegged at 46 cents.
Zacks Rank and Stocks to Consider
Semtech currently has a Zacks Rank #4 (Sell). Some better-ranked stocks in the broader technology sector include Alphabet Inc. GOOGL, Itron, Inc. ITRI and Teradyne, Inc. TER, each carrying a Zacks Rank #2 (Buy). You can see the complete list of today’s Zacks #1 Rank (Strong Buy) stocks here.
Long-term earnings growth for Alphabet, Itron and Teradyne is currently projected at 17.5%, 25% and 11.4%, respectively.
Today's Best Stocks from Zacks
Would you like to see the updated picks from our best market-beating strategies? From 2017 through 2018, while the S&P 500 gained +15.8%, five of our screens returned +38.0%, +61.3%, +61.6%, +68.1%, and +98.3%.
This outperformance has not just been a recent phenomenon. From 2000 – 2018, while the S&P averaged +4.8% per year, our top strategies averaged up to +56.2% per year.
See their latest picks free >>
Want the latest recommendations from Zacks Investment Research? Today, you can download 7 Best Stocks for the Next 30 Days. Click to get this free report
Alphabet Inc. (GOOGL) : Free Stock Analysis Report
Semtech Corporation (SMTC) : Free Stock Analysis Report
Itron, Inc. (ITRI) : Free Stock Analysis Report
Teradyne, Inc. (TER) : Free Stock Analysis Report
To read this article on Zacks.com click here.
