
 Yahoo Finance
 Senheng New Retail Berhad (KLSE:SENHENG) Could Be Struggling To Allocate Capital
Did you know there are some financial metrics that can provide clues of a potential multi-bagger? Amongst other things, we'll want to see two things; firstly, a growing return on capital employed (ROCE) and secondly, an expansion in the company's amount of capital employed. Put simply, these types of businesses are compounding machines, meaning they are continually reinvesting their earnings at ever-higher rates of return. Although, when we looked at Senheng New Retail Berhad (KLSE:SENHENG), it didn't seem to tick all of these boxes.
Understanding Return On Capital Employed (ROCE)
If you haven't worked with ROCE before, it measures the 'return' (pre-tax profit) a company generates from capital employed in its business. To calculate this metric for Senheng New Retail Berhad, this is the formula:
Return on Capital Employed = Earnings Before Interest and Tax (EBIT) ÷ (Total Assets - Current Liabilities)
0.05 = RM33m ÷ (RM910m - RM254m) (Based on the trailing twelve months to March 2024).
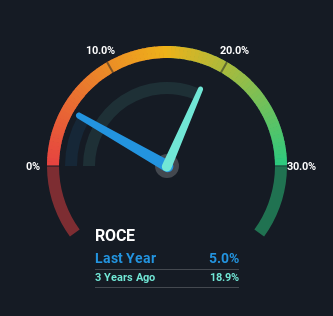
So, Senheng New Retail Berhad has an ROCE of 5.0%. Ultimately, that's a low return and it under-performs the Specialty Retail industry average of 12%.
Check out our latest analysis for Senheng New Retail Berhad
While the past is not representative of the future, it can be helpful to know how a company has performed historically, which is why we have this chart above. If you're interested in investigating Senheng New Retail Berhad's past further, check out this free graph covering Senheng New Retail Berhad's past earnings, revenue and cash flow.
What Can We Tell From Senheng New Retail Berhad's ROCE Trend?
When we looked at the ROCE trend at Senheng New Retail Berhad, we didn't gain much confidence. Around five years ago the returns on capital were 24%, but since then they've fallen to 5.0%. And considering revenue has dropped while employing more capital, we'd be cautious. This could mean that the business is losing its competitive advantage or market share, because while more money is being put into ventures, it's actually producing a lower return - "less bang for their buck" per se.
On a side note, Senheng New Retail Berhad has done well to pay down its current liabilities to 28% of total assets. That could partly explain why the ROCE has dropped. Effectively this means their suppliers or short-term creditors are funding less of the business, which reduces some elements of risk. Since the business is basically funding more of its operations with it's own money, you could argue this has made the business less efficient at generating ROCE.
Our Take On Senheng New Retail Berhad's ROCE
From the above analysis, we find it rather worrisome that returns on capital and sales for Senheng New Retail Berhad have fallen, meanwhile the business is employing more capital than it was five years ago. And long term shareholders have watched their investments stay flat over the last year. That being the case, unless the underlying trends revert to a more positive trajectory, we'd consider looking elsewhere.
If you want to know some of the risks facing Senheng New Retail Berhad we've found 2 warning signs (1 is significant!) that you should be aware of before investing here.
If you want to search for solid companies with great earnings, check out this free list of companies with good balance sheets and impressive returns on equity.
Have feedback on this article? Concerned about the content? Get in touch with us directly. Alternatively, email editorial-team (at) simplywallst.com.
This article by Simply Wall St is general in nature. We provide commentary based on historical data and analyst forecasts only using an unbiased methodology and our articles are not intended to be financial advice. It does not constitute a recommendation to buy or sell any stock, and does not take account of your objectives, or your financial situation. We aim to bring you long-term focused analysis driven by fundamental data. Note that our analysis may not factor in the latest price-sensitive company announcements or qualitative material. Simply Wall St has no position in any stocks mentioned.
Have feedback on this article? Concerned about the content? Get in touch with us directly. Alternatively, email editorial-team@simplywallst.com
