September 2017 Support in Play for Yen Soon?
September 2017 support levels may now become the focus for Yen traders.
Yen Proves Capable of Sustaining Gains
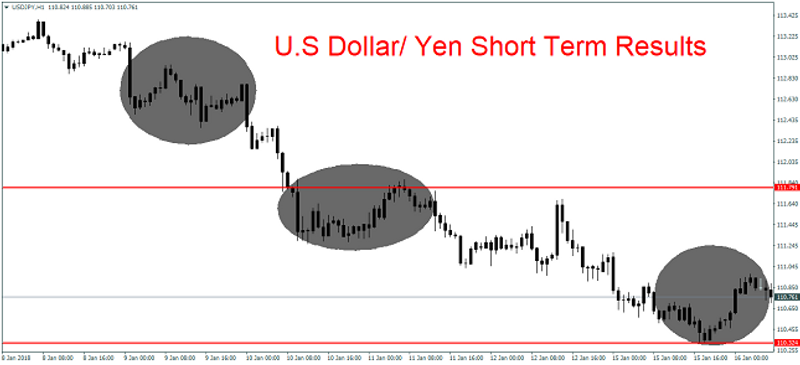
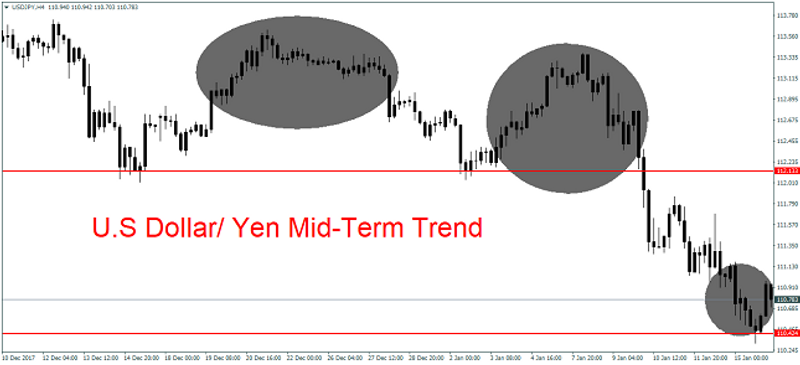
The Yen has proven capable of sustaining strong gains against the U.S Dollar. The Japanese currency is near 110.80 after having broken important support levels last week.

A look at a short-term and a mid-term chart of the Yen is probably enough to make short-term traders suspicious about the Yen’s strength continuing to prosper.
Deflationary Crisis Coming to an End in Japan
However, recent economic data from Japan has highlighted an improving statistical landscape for the nation. And the Bank of Japan has been quoted as saying, it believes the deflationary crisis which has plagued the country may be approaching its end.

The Nikkei equity index has certainly achieved solid gains the past six months, and interestingly the Yen has started to show divergence with the Nikkei Index.
Long-Term Chart Provides Tempting Ratio
The past few years have seen the Yen weaken if the Nikkei has grown stronger, but the past couple of months have begun to produce a different trend line.
Interestingly a long-term chart of the Yen may provide the impetus for traders to remain sellers of the U.S Dollar against the Yen. Critical support ratios were tested this past September and the Japanese currency may again try to test the 109.00 price levels.

In the short term, we believe the Yen may be positive. In the mid-term and long-term we are unbiased.
Yaron Mazor is a senior analyst at SuperTraderTV.
SuperTraderTV Academy is a leader in investing and stock trading education. Sign up for a class today to learn proven strategies on how to trade smarter.
This article was originally posted on FX Empire
More From FXEMPIRE:
E-mini NASDAQ-100 Index (NQ) Futures Technical Analysis – January 16, 2018 Forecast
E-mini S&P 500 Index (ES) Futures Technical Analysis – January 16, 2018 Forecast
Gold Price Futures (GC) Technical Analysis – January 16, 2018 Forecast
US Futures Set to Open Higher, Dow Aims 26,000 for the First Time

 Yahoo Finance