
 Yahoo Finance
 Serabi Gold (LON:SRB) Shareholders Will Want The ROCE Trajectory To Continue
If we want to find a stock that could multiply over the long term, what are the underlying trends we should look for? Ideally, a business will show two trends; firstly a growing return on capital employed (ROCE) and secondly, an increasing amount of capital employed. This shows us that it's a compounding machine, able to continually reinvest its earnings back into the business and generate higher returns. With that in mind, we've noticed some promising trends at Serabi Gold (LON:SRB) so let's look a bit deeper.
Understanding Return On Capital Employed (ROCE)
For those who don't know, ROCE is a measure of a company's yearly pre-tax profit (its return), relative to the capital employed in the business. Analysts use this formula to calculate it for Serabi Gold:
Return on Capital Employed = Earnings Before Interest and Tax (EBIT) ÷ (Total Assets - Current Liabilities)
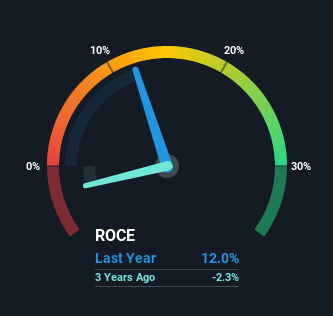
0.12 = US$10.0m ÷ (US$91m - US$7.8m) (Based on the trailing twelve months to September 2021).
So, Serabi Gold has an ROCE of 12%. In absolute terms, that's a pretty standard return but compared to the Metals and Mining industry average it falls behind.
Check out our latest analysis for Serabi Gold
In the above chart we have measured Serabi Gold's prior ROCE against its prior performance, but the future is arguably more important. If you'd like to see what analysts are forecasting going forward, you should check out our free report for Serabi Gold.
So How Is Serabi Gold's ROCE Trending?
We like the trends that we're seeing from Serabi Gold. Over the last five years, returns on capital employed have risen substantially to 12%. The company is effectively making more money per dollar of capital used, and it's worth noting that the amount of capital has increased too, by 27%. This can indicate that there's plenty of opportunities to invest capital internally and at ever higher rates, a combination that's common among multi-baggers.
The Key Takeaway
All in all, it's terrific to see that Serabi Gold is reaping the rewards from prior investments and is growing its capital base. Given the stock has declined 42% in the last five years, this could be a good investment if the valuation and other metrics are also appealing. So researching this company further and determining whether or not these trends will continue seems justified.
Like most companies, Serabi Gold does come with some risks, and we've found 3 warning signs that you should be aware of.
While Serabi Gold isn't earning the highest return, check out this free list of companies that are earning high returns on equity with solid balance sheets.
Have feedback on this article? Concerned about the content? Get in touch with us directly. Alternatively, email editorial-team (at) simplywallst.com.
This article by Simply Wall St is general in nature. We provide commentary based on historical data and analyst forecasts only using an unbiased methodology and our articles are not intended to be financial advice. It does not constitute a recommendation to buy or sell any stock, and does not take account of your objectives, or your financial situation. We aim to bring you long-term focused analysis driven by fundamental data. Note that our analysis may not factor in the latest price-sensitive company announcements or qualitative material. Simply Wall St has no position in any stocks mentioned.
