
 Yahoo Finance
 Some Serco Group (LON:SRP) Shareholders Have Copped A Big 65% Share Price Drop

We think intelligent long term investing is the way to go. But that doesn't mean long term investors can avoid big losses. For example the Serco Group plc (LON:SRP) share price dropped 65% over five years. That is extremely sub-optimal, to say the least. The silver lining is that the stock is up 3.3% in about a week.
Want to participate in a short research study? Help shape the future of investing tools and you could win a $250 gift card!
View our latest analysis for Serco Group
In his essay The Superinvestors of Graham-and-Doddsville Warren Buffett described how share prices do not always rationally reflect the value of a business. By comparing earnings per share (EPS) and share price changes over time, we can get a feel for how investor attitudes to a company have morphed over time.
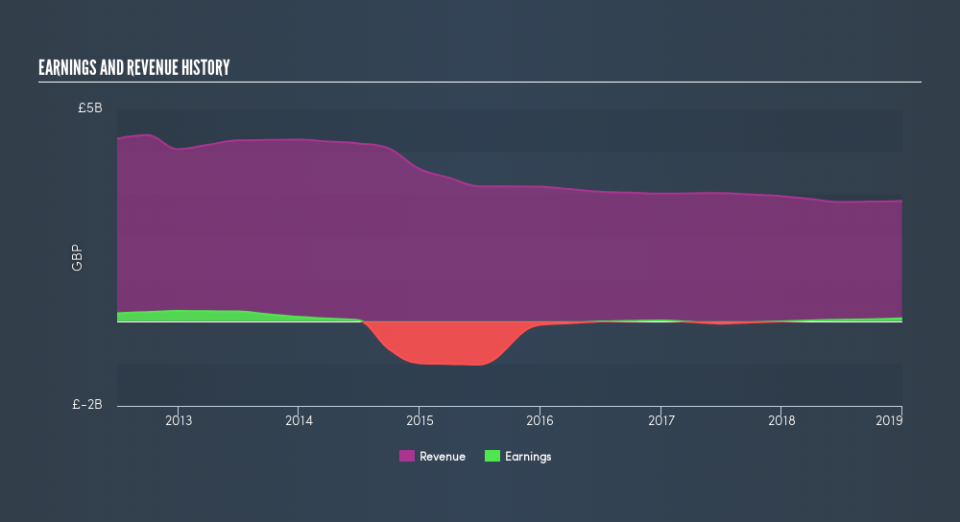
Serco Group became profitable within the last five years. That would generally be considered a positive, so we are surprised to see the share price is down. Other metrics may better explain the share price move.
It could be that the revenue decline of 8.7% per year is viewed as evidence that Serco Group is shrinking. This has probably encouraged some shareholders to sell down the stock.
Depicted in the graphic below, you'll see revenue and earnings over time. If you want more detail, you can click on the chart itself.
Serco Group is a well known stock, with plenty of analyst coverage, suggesting some visibility into future growth. So we recommend checking out this free report showing consensus forecasts
What about the Total Shareholder Return (TSR)?
We've already covered Serco Group's share price action, but we should also mention its total shareholder return (TSR). Arguably the TSR is a more complete return calculation because it accounts for the value of dividends (as if they were reinvested), along with the hypothetical value of any discounted capital that have been offered to shareholders. Dividends have been really beneficial for Serco Group shareholders, and that cash payout explains why its total shareholder loss of 56%, over the last 5 years, isn't as bad as the share price return.
A Different Perspective
We're pleased to report that Serco Group shareholders have received a total shareholder return of 32% over one year. There's no doubt those recent returns are much better than the TSR loss of 15% per year over five years. The long term loss makes us cautious, but the short term TSR gain certainly hints at a brighter future. Most investors take the time to check the data on insider transactions. You can click here to see if insiders have been buying or selling.
Of course, you might find a fantastic investment by looking elsewhere. So take a peek at this free list of companies we expect will grow earnings.
Please note, the market returns quoted in this article reflect the market weighted average returns of stocks that currently trade on GB exchanges.
We aim to bring you long-term focused research analysis driven by fundamental data. Note that our analysis may not factor in the latest price-sensitive company announcements or qualitative material.
If you spot an error that warrants correction, please contact the editor at editorial-team@simplywallst.com. This article by Simply Wall St is general in nature. It does not constitute a recommendation to buy or sell any stock, and does not take account of your objectives, or your financial situation. Simply Wall St has no position in the stocks mentioned. Thank you for reading.
