
 Yahoo Finance
 Is Serco Group plc's (LON:SRP) Stock's Recent Performance Being Led By Its Attractive Financial Prospects?
Most readers would already be aware that Serco Group's (LON:SRP) stock increased significantly by 9.5% over the past week. Since the market usually pay for a company’s long-term fundamentals, we decided to study the company’s key performance indicators to see if they could be influencing the market. In this article, we decided to focus on Serco Group's ROE.
ROE or return on equity is a useful tool to assess how effectively a company can generate returns on the investment it received from its shareholders. In simpler terms, it measures the profitability of a company in relation to shareholder's equity.
View our latest analysis for Serco Group
How Is ROE Calculated?
ROE can be calculated by using the formula:
Return on Equity = Net Profit (from continuing operations) ÷ Shareholders' Equity
So, based on the above formula, the ROE for Serco Group is:
30% = UK£304m ÷ UK£1.0b (Based on the trailing twelve months to December 2021).
The 'return' is the yearly profit. Another way to think of that is that for every £1 worth of equity, the company was able to earn £0.30 in profit.
What Has ROE Got To Do With Earnings Growth?
We have already established that ROE serves as an efficient profit-generating gauge for a company's future earnings. We now need to evaluate how much profit the company reinvests or "retains" for future growth which then gives us an idea about the growth potential of the company. Assuming everything else remains unchanged, the higher the ROE and profit retention, the higher the growth rate of a company compared to companies that don't necessarily bear these characteristics.
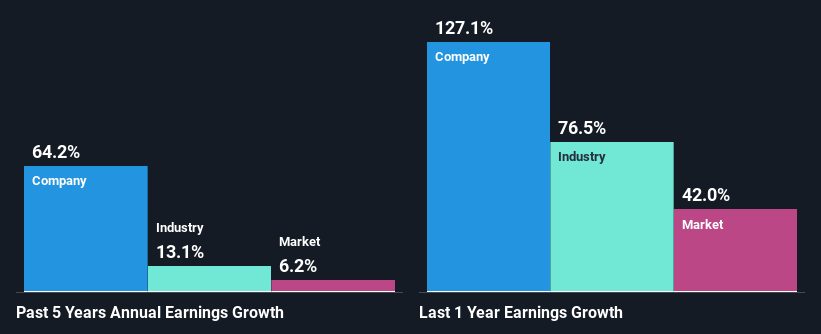
A Side By Side comparison of Serco Group's Earnings Growth And 30% ROE
Firstly, we acknowledge that Serco Group has a significantly high ROE. Secondly, even when compared to the industry average of 12% the company's ROE is quite impressive. So, the substantial 64% net income growth seen by Serco Group over the past five years isn't overly surprising.
As a next step, we compared Serco Group's net income growth with the industry, and pleasingly, we found that the growth seen by the company is higher than the average industry growth of 13%.
Earnings growth is an important metric to consider when valuing a stock. What investors need to determine next is if the expected earnings growth, or the lack of it, is already built into the share price. Doing so will help them establish if the stock's future looks promising or ominous. Has the market priced in the future outlook for SRP? You can find out in our latest intrinsic value infographic research report.
Is Serco Group Making Efficient Use Of Its Profits?
Serco Group's three-year median payout ratio to shareholders is 10.0%, which is quite low. This implies that the company is retaining 90% of its profits. So it seems like the management is reinvesting profits heavily to grow its business and this reflects in its earnings growth number.
Besides, Serco Group has been paying dividends for at least ten years or more. This shows that the company is committed to sharing profits with its shareholders. Looking at the current analyst consensus data, we can see that the company's future payout ratio is expected to rise to 30% over the next three years. Accordingly, the expected increase in the payout ratio explains the expected decline in the company's ROE to 13%, over the same period.
Summary
In total, we are pretty happy with Serco Group's performance. In particular, it's great to see that the company is investing heavily into its business and along with a high rate of return, that has resulted in a sizeable growth in its earnings. Having said that, on studying current analyst estimates, we were concerned to see that while the company has grown its earnings in the past, analysts expect its earnings to shrink in the future. Are these analysts expectations based on the broad expectations for the industry, or on the company's fundamentals? Click here to be taken to our analyst's forecasts page for the company.
Have feedback on this article? Concerned about the content? Get in touch with us directly. Alternatively, email editorial-team (at) simplywallst.com.
This article by Simply Wall St is general in nature. We provide commentary based on historical data and analyst forecasts only using an unbiased methodology and our articles are not intended to be financial advice. It does not constitute a recommendation to buy or sell any stock, and does not take account of your objectives, or your financial situation. We aim to bring you long-term focused analysis driven by fundamental data. Note that our analysis may not factor in the latest price-sensitive company announcements or qualitative material. Simply Wall St has no position in any stocks mentioned.
