
 Yahoo Finance
 Is Serco Group plc's (LON:SRP) Balance Sheet Strong Enough To Weather A Storm?

Want to participate in a short research study? Help shape the future of investing tools and you could win a $250 gift card!
Stocks with market capitalization between $2B and $10B, such as Serco Group plc (LON:SRP) with a size of UK£1.7b, do not attract as much attention from the investing community as do the small-caps and large-caps. Surprisingly though, when accounted for risk, mid-caps have delivered better returns compared to the two other categories of stocks. This article will examine SRP’s financial liquidity and debt levels to get an idea of whether the company can deal with cyclical downturns and maintain funds to accommodate strategic spending for future growth. Note that this commentary is very high-level and solely focused on financial health, so I suggest you dig deeper yourself into SRP here.
View our latest analysis for Serco Group
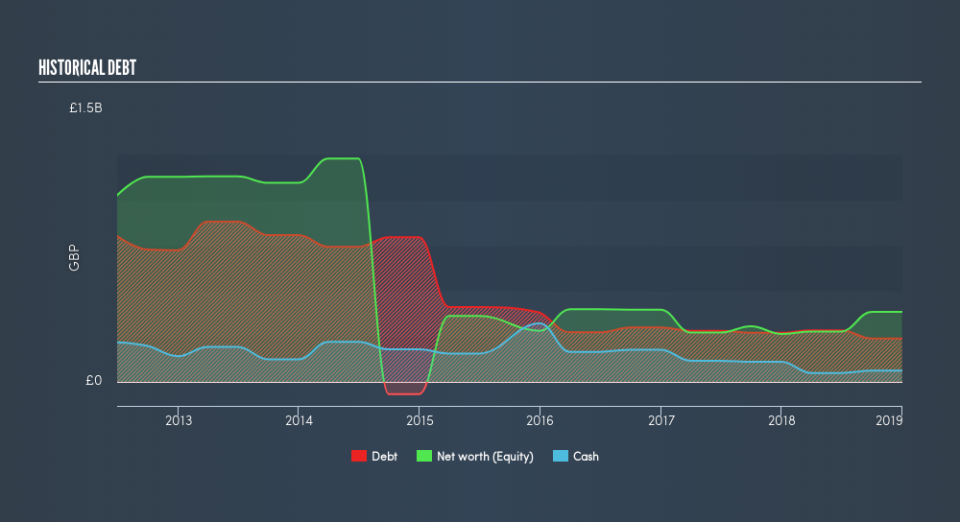
Does SRP Produce Much Cash Relative To Its Debt?
SRP has shrunk its total debt levels in the last twelve months, from UK£292m to UK£254m – this includes long-term debt. With this debt repayment, the current cash and short-term investment levels stands at UK£63m , ready to be used for running the business. Moreover, SRP has generated UK£2.7m in operating cash flow in the last twelve months, resulting in an operating cash to total debt ratio of 1.1%, indicating that SRP’s operating cash is less than its debt.
Can SRP meet its short-term obligations with the cash in hand?
At the current liabilities level of UK£675m, it appears that the company may not have an easy time meeting these commitments with a current assets level of UK£644m, leading to a current ratio of 0.95x. The current ratio is calculated by dividing current assets by current liabilities.
Is SRP’s debt level acceptable?
With debt reaching 66% of equity, SRP may be thought of as relatively highly levered. This is not unusual for mid-caps as debt tends to be a cheaper and faster source of funding for some businesses. No matter how high the company’s debt, if it can easily cover the interest payments, it’s considered to be efficient with its use of excess leverage. A company generating earnings after interest and tax at least three times its net interest payments is considered financially sound. In SRP's case, the ratio of 7.74x suggests that interest is appropriately covered, which means that lenders may be inclined to lend more money to the company, as it is seen as safe in terms of payback.
Next Steps:
Although SRP’s debt level is towards the higher end of the spectrum, its cash flow coverage seems adequate to meet debt obligations which means its debt is being efficiently utilised. But, its lack of liquidity raises questions over current asset management practices for the mid-cap. Keep in mind I haven't considered other factors such as how SRP has been performing in the past. I suggest you continue to research Serco Group to get a better picture of the stock by looking at:
Future Outlook: What are well-informed industry analysts predicting for SRP’s future growth? Take a look at our free research report of analyst consensus for SRP’s outlook.
Valuation: What is SRP worth today? Is the stock undervalued, even when its growth outlook is factored into its intrinsic value? The intrinsic value infographic in our free research report helps visualize whether SRP is currently mispriced by the market.
Other High-Performing Stocks: Are there other stocks that provide better prospects with proven track records? Explore our free list of these great stocks here.
We aim to bring you long-term focused research analysis driven by fundamental data. Note that our analysis may not factor in the latest price-sensitive company announcements or qualitative material.
If you spot an error that warrants correction, please contact the editor at editorial-team@simplywallst.com. This article by Simply Wall St is general in nature. It does not constitute a recommendation to buy or sell any stock, and does not take account of your objectives, or your financial situation. Simply Wall St has no position in the stocks mentioned. Thank you for reading.
