
 Yahoo Finance
 Is Servizi Italia S.p.A. (BIT:SRI) A Strong Dividend Stock?

Today we'll take a closer look at Servizi Italia S.p.A. (BIT:SRI) from a dividend investor's perspective. Owning a strong business and reinvesting the dividends is widely seen as an attractive way of growing your wealth. If you are hoping to live on the income from dividends, it's important to be a lot more stringent with your investments than the average punter.
A high yield and a long history of paying dividends is an appealing combination for Servizi Italia. It would not be a surprise to discover that many investors buy it for the dividends. During the year, the company also conducted a buyback equivalent to around 1.8% of its market capitalisation. Some simple analysis can reduce the risk of holding Servizi Italia for its dividend, and we'll focus on the most important aspects below.
Explore this interactive chart for our latest analysis on Servizi Italia!
Payout ratios
Dividends are typically paid from company earnings. If a company pays more in dividends than it earned, then the dividend might become unsustainable - hardly an ideal situation. Comparing dividend payments to a company's net profit after tax is a simple way of reality-checking whether a dividend is sustainable. In the last year, Servizi Italia paid out 55% of its profit as dividends. A payout ratio above 50% generally implies a business is reaching maturity, although it is still possible to reinvest in the business or increase the dividend over time.
Another important check we do is to see if the free cash flow generated is sufficient to pay the dividend. Last year, Servizi Italia paid a dividend while reporting negative free cash flow. While there may be an explanation, we think this behaviour is generally not sustainable.
Is Servizi Italia's Balance Sheet Risky?
As Servizi Italia has a meaningful amount of debt, we need to check its balance sheet to see if the company might have debt risks. A rough way to check this is with these two simple ratios: a) net debt divided by EBITDA (earnings before interest, tax, depreciation and amortisation), and b) net interest cover. Net debt to EBITDA is a measure of a company's total debt. Net interest cover measures the ability to meet interest payments. Essentially we check that a) the company does not have too much debt, and b) that it can afford to pay the interest. With net debt of 2.07 times its EBITDA, Servizi Italia has a noticeable amount of debt, although if business stays steady, this may not be overly concerning.
We calculated its interest cover by measuring its earnings before interest and tax (EBIT), and dividing this by the company's net interest expense. Net interest cover of 11.53 times its interest expense appears reasonable for Servizi Italia, although we're conscious that even high interest cover doesn't make a company bulletproof.
Consider getting our latest analysis on Servizi Italia's financial position here.
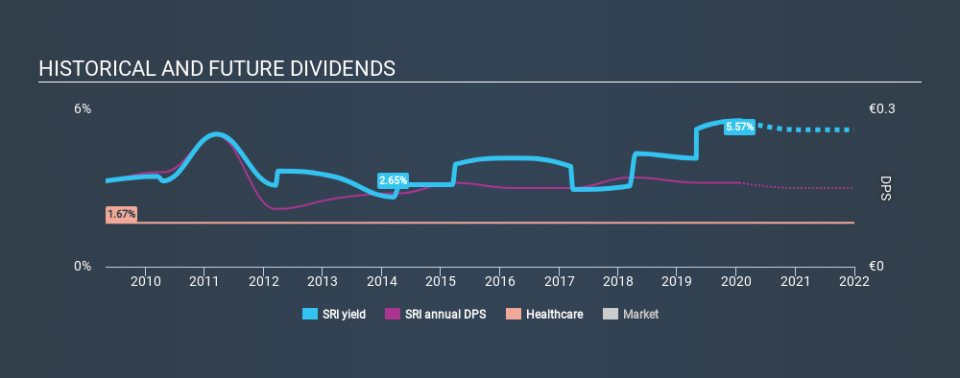
Dividend Volatility
From the perspective of an income investor who wants to earn dividends for many years, there is not much point buying a stock if its dividend is regularly cut or is not reliable. Servizi Italia has been paying dividends for a long time, but for the purpose of this analysis, we only examine the past 10 years of payments. The dividend has been cut on at least one occasion historically. Its most recent annual dividend was €0.16 per share, effectively flat on its first payment ten years ago.
It's good to see some dividend growth, but the dividend has been cut at least once, and the size of the cut would eliminate most of the growth, anyway. We're not that enthused by this.
Dividend Growth Potential
Given that the dividend has been cut in the past, we need to check if earnings are growing and if that might lead to stronger dividends in the future. Over the past five years, it looks as though Servizi Italia's EPS have declined at around 2.2% a year. If earnings continue to decline, the dividend may come under pressure. Every investor should make an assessment of whether the company is taking steps to stabilise the situation.
Conclusion
Dividend investors should always want to know if a) a company's dividends are affordable, b) if there is a track record of consistent payments, and c) if the dividend is capable of growing. First, the company has a payout ratio that was within an average range for most dividend stocks, but it paid out virtually all of its generated cash flow. Earnings per share have been falling, and the company has cut its dividend at least once in the past. From a dividend perspective, this is a cause for concern. There are a few too many issues for us to get comfortable with Servizi Italia from a dividend perspective. Businesses can change, but we would struggle to identify why an investor should rely on this stock for their income.
Are management backing themselves to deliver performance? Check their shareholdings in Servizi Italia in our latest insider ownership analysis.
Looking for more high-yielding dividend ideas? Try our curated list of dividend stocks with a yield above 3%.
If you spot an error that warrants correction, please contact the editor at editorial-team@simplywallst.com. This article by Simply Wall St is general in nature. It does not constitute a recommendation to buy or sell any stock, and does not take account of your objectives, or your financial situation. Simply Wall St has no position in the stocks mentioned.
We aim to bring you long-term focused research analysis driven by fundamental data. Note that our analysis may not factor in the latest price-sensitive company announcements or qualitative material. Thank you for reading.
