
 Yahoo Finance
 SGS AG's Dividend Analysis
Exploring the Sustainability and Growth of SGS AG's Dividends
SGS AG(SGSOY) recently announced a dividend of $0.36 per share, payable on 2024-04-19, with the ex-dividend date set for 2024-04-02. As investors look forward to this upcoming payment, the spotlight also shines on the company's dividend history, yield, and growth rates. Using the data from GuruFocus, let's look into SGS AGs dividend performance and assess its sustainability.
What Does SGS AG Do?
This Powerful Chart Made Peter Lynch 29% A Year For 13 Years
How to calculate the intrinsic value of a stock?
Switzerland-listed SGS is the largest and one of the oldest companies in the testing, inspection, and certification industry. The company's primary activities involve testing products and materials, inspecting sites/industrial equipment, and certifying products and systems to ensure global/company standards. SGS is one of only four TIC companies that operate globally across numerous industries, including agriculture, food and life science, and transport services. SGS was first listed in 1981 and employs almost 100,000 people worldwide.

A Glimpse at SGS AG's Dividend History
SGS AG has maintained a consistent dividend payment record since 2009. Dividends are currently distributed on a yearly basis.
Below is a chart showing annual Dividends Per Share for tracking historical trends.
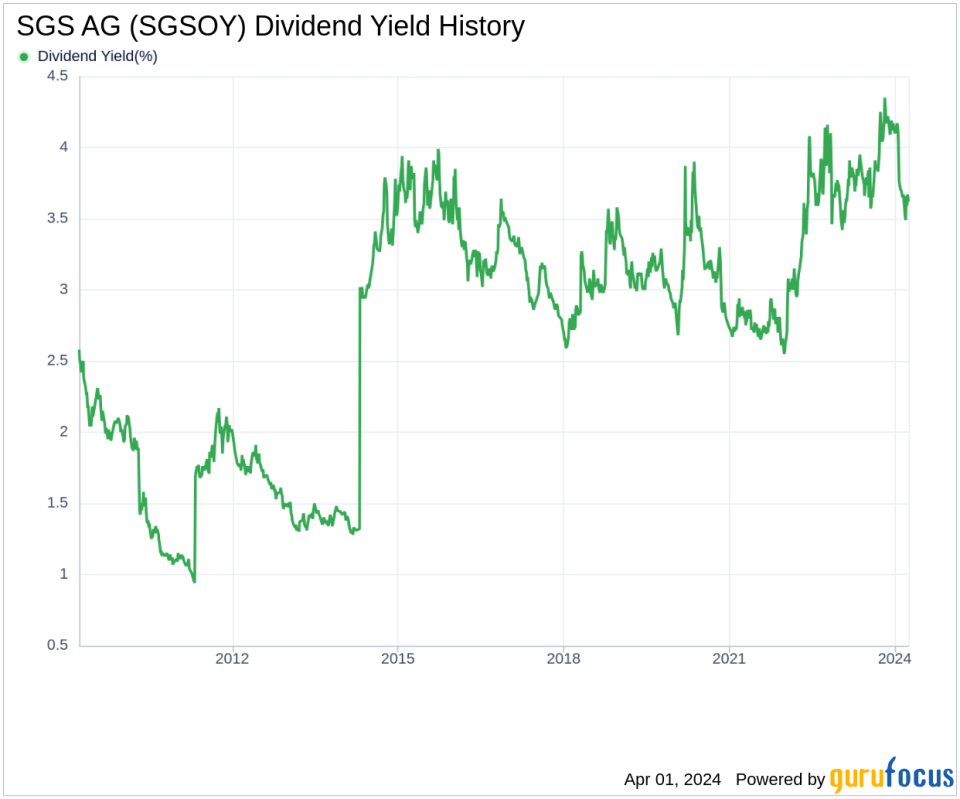
Breaking Down SGS AG's Dividend Yield and Growth
As of today, SGS AG currently has a 12-month trailing dividend yield of 3.62% and a 12-month forward dividend yield of 3.75%. This suggests an expectation of increased dividend payments over the next 12 months.
Extended to a five-year horizon, this rate increased to 1.20% per year. And over the past decade, SGS AG's annual dividends per share growth rate stands at 6.20%.
Based on SGS AG's dividend yield and five-year growth rate, the 5-year yield on cost of SGS AG stock as of today is approximately 3.84%.
The Sustainability Question: Payout Ratio and Profitability
To assess the sustainability of the dividend, one needs to evaluate the company's payout ratio. The dividend payout ratio provides insights into the portion of earnings the company distributes as dividends. A lower ratio suggests that the company retains a significant part of its earnings, thereby ensuring the availability of funds for future growth and unexpected downturns. As of 2023-12-31, SGS AG's dividend payout ratio is 0.99, which may suggest that the company's dividend may not be sustainable.
SGS AG's profitability rank, offers an understanding of the company's earnings prowess relative to its peers. GuruFocus ranks SGS AG's profitability 8 out of 10 as of 2023-12-31, suggesting good profitability prospects. The company has reported positive net income for each of year over the past decade, further solidifying its high profitability.
Growth Metrics: The Future Outlook
To ensure the sustainability of dividends, a company must have robust growth metrics. SGS AG's growth rank of 8 out of 10 suggests that the company's growth trajectory is good relative to its competitors.
Revenue is the lifeblood of any company, and SGS AG's revenue per share, combined with the 3-year revenue growth rate, indicates a strong revenue model. SGS AG's revenue has increased by approximately 6.30% per year on average, a rate that underperforms than approximately 50.2% of global competitors.
The company's 3-year EPS growth rate showcases its capability to grow its earnings, a critical component for sustaining dividends in the long run. During the past three years, SGS AG's earnings increased by approximately 8.40% per year on average, a rate that underperforms than approximately 57.16% of global competitors.
Lastly, the company's 5-year EBITDA growth rate of -3.10%, which underperforms than approximately 77.64% of global competitors.
Next Steps
Considering SGS AG's robust dividend history and yield, investors may find the stock an attractive option for stable income. However, the high payout ratio and mixed growth metrics warrant a cautious approach. The company's strong profitability rank and consistent net income are reassuring, yet the underperformance in revenue and earnings growth compared to industry peers suggests that potential investors should keep an eye on the company's future performance and strategic initiatives. Will SGS AG continue to deliver shareholder value through dividends, or will growth challenges necessitate a reassessment of its payout policies? Only time will tell.
GuruFocus Premium users can screen for high-dividend yield stocks using the High Dividend Yield Screener.
This article, generated by GuruFocus, is designed to provide general insights and is not tailored financial advice. Our commentary is rooted in historical data and analyst projections, utilizing an impartial methodology, and is not intended to serve as specific investment guidance. It does not formulate a recommendation to purchase or divest any stock and does not consider individual investment objectives or financial circumstances. Our objective is to deliver long-term, fundamental data-driven analysis. Be aware that our analysis might not incorporate the most recent, price-sensitive company announcements or qualitative information. GuruFocus holds no position in the stocks mentioned herein.
This article first appeared on GuruFocus.
