
 Yahoo Finance
 Shareholders 7.0% loss in OSB Group (LON:OSB) partly attributable to the company's decline in earnings over past year
Passive investing in an index fund is a good way to ensure your own returns roughly match the overall market. While individual stocks can be big winners, plenty more fail to generate satisfactory returns. Investors in OSB Group Plc (LON:OSB) have tasted that bitter downside in the last year, as the share price dropped 15%. That's disappointing when you consider the market returned 6.7%. Looking at the longer term, the stock is down 13% over three years. In contrast, the stock price has popped 8.8% in the last thirty days.
Although the past week has been more reassuring for shareholders, they're still in the red over the last year, so let's see if the underlying business has been responsible for the decline.
See our latest analysis for OSB Group
There is no denying that markets are sometimes efficient, but prices do not always reflect underlying business performance. One imperfect but simple way to consider how the market perception of a company has shifted is to compare the change in the earnings per share (EPS) with the share price movement.
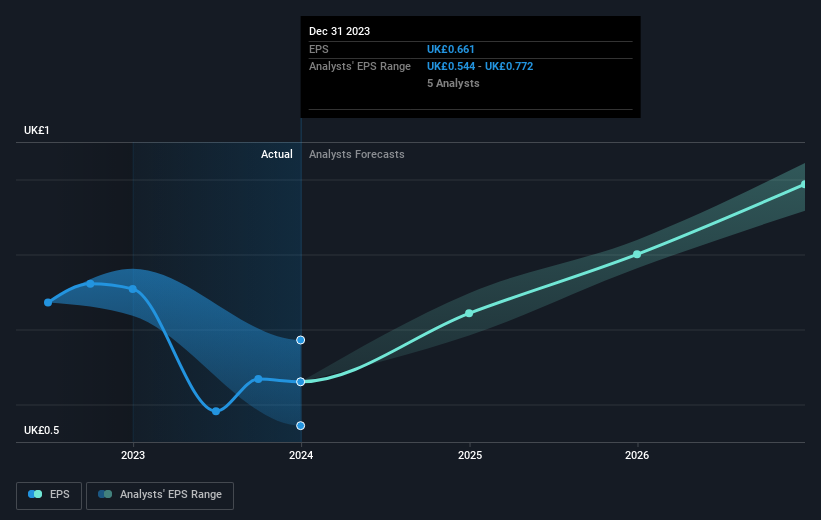
Unhappily, OSB Group had to report a 27% decline in EPS over the last year. The share price fall of 15% isn't as bad as the reduction in earnings per share. So despite the weak per-share profits, some investors are probably relieved the situation wasn't more difficult.
You can see below how EPS has changed over time (discover the exact values by clicking on the image).
We like that insiders have been buying shares in the last twelve months. Having said that, most people consider earnings and revenue growth trends to be a more meaningful guide to the business. This free interactive report on OSB Group's earnings, revenue and cash flow is a great place to start, if you want to investigate the stock further.
What About Dividends?
It is important to consider the total shareholder return, as well as the share price return, for any given stock. The TSR incorporates the value of any spin-offs or discounted capital raisings, along with any dividends, based on the assumption that the dividends are reinvested. Arguably, the TSR gives a more comprehensive picture of the return generated by a stock. In the case of OSB Group, it has a TSR of -7.0% for the last 1 year. That exceeds its share price return that we previously mentioned. The dividends paid by the company have thusly boosted the total shareholder return.
A Different Perspective
While the broader market gained around 6.7% in the last year, OSB Group shareholders lost 7.0% (even including dividends). However, keep in mind that even the best stocks will sometimes underperform the market over a twelve month period. On the bright side, long term shareholders have made money, with a gain of 5% per year over half a decade. It could be that the recent sell-off is an opportunity, so it may be worth checking the fundamental data for signs of a long term growth trend. It's always interesting to track share price performance over the longer term. But to understand OSB Group better, we need to consider many other factors. To that end, you should be aware of the 1 warning sign we've spotted with OSB Group .
OSB Group is not the only stock insiders are buying. So take a peek at this free list of growing companies with insider buying.
Please note, the market returns quoted in this article reflect the market weighted average returns of stocks that currently trade on British exchanges.
Have feedback on this article? Concerned about the content? Get in touch with us directly. Alternatively, email editorial-team (at) simplywallst.com.
This article by Simply Wall St is general in nature. We provide commentary based on historical data and analyst forecasts only using an unbiased methodology and our articles are not intended to be financial advice. It does not constitute a recommendation to buy or sell any stock, and does not take account of your objectives, or your financial situation. We aim to bring you long-term focused analysis driven by fundamental data. Note that our analysis may not factor in the latest price-sensitive company announcements or qualitative material. Simply Wall St has no position in any stocks mentioned.
