
 Yahoo Finance
 Shareholders in Alibaba Group Holding (NYSE:BABA) are in the red if they invested five years ago
Generally speaking long term investing is the way to go. But along the way some stocks are going to perform badly. For example, after five long years the Alibaba Group Holding Limited (NYSE:BABA) share price is a whole 55% lower. That's not a lot of fun for true believers. And it's not just long term holders hurting, because the stock is down 45% in the last year. Shareholders have had an even rougher run lately, with the share price down 29% in the last 90 days.
Since shareholders are down over the longer term, lets look at the underlying fundamentals over the that time and see if they've been consistent with returns.
View our latest analysis for Alibaba Group Holding
While the efficient markets hypothesis continues to be taught by some, it has been proven that markets are over-reactive dynamic systems, and investors are not always rational. One way to examine how market sentiment has changed over time is to look at the interaction between a company's share price and its earnings per share (EPS).
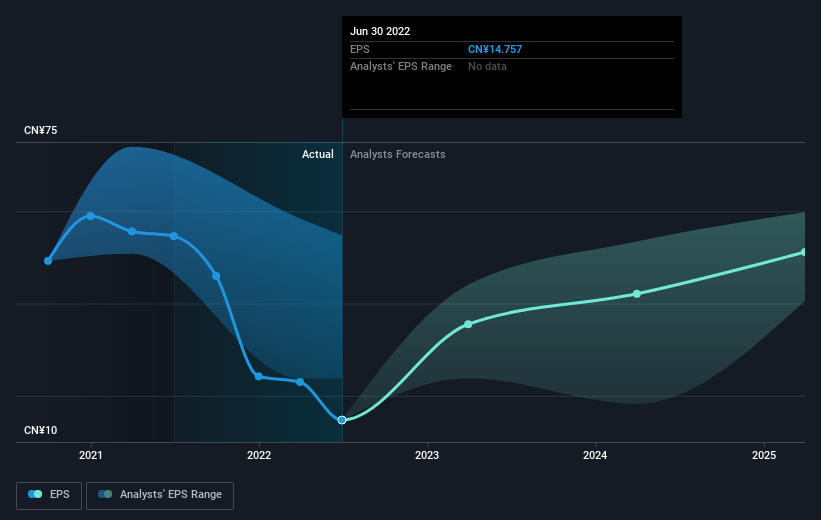
Looking back five years, both Alibaba Group Holding's share price and EPS declined; the latter at a rate of 5.9% per year. This reduction in EPS is less than the 15% annual reduction in the share price. This implies that the market was previously too optimistic about the stock.
The image below shows how EPS has tracked over time (if you click on the image you can see greater detail).
Before buying or selling a stock, we always recommend a close examination of historic growth trends, available here.
A Different Perspective
While the broader market lost about 19% in the twelve months, Alibaba Group Holding shareholders did even worse, losing 45%. Having said that, it's inevitable that some stocks will be oversold in a falling market. The key is to keep your eyes on the fundamental developments. Unfortunately, last year's performance may indicate unresolved challenges, given that it was worse than the annualised loss of 9% over the last half decade. Generally speaking long term share price weakness can be a bad sign, though contrarian investors might want to research the stock in hope of a turnaround. While it is well worth considering the different impacts that market conditions can have on the share price, there are other factors that are even more important. To that end, you should be aware of the 2 warning signs we've spotted with Alibaba Group Holding .
If you are like me, then you will not want to miss this free list of growing companies that insiders are buying.
Please note, the market returns quoted in this article reflect the market weighted average returns of stocks that currently trade on US exchanges.
Have feedback on this article? Concerned about the content? Get in touch with us directly. Alternatively, email editorial-team (at) simplywallst.com.
This article by Simply Wall St is general in nature. We provide commentary based on historical data and analyst forecasts only using an unbiased methodology and our articles are not intended to be financial advice. It does not constitute a recommendation to buy or sell any stock, and does not take account of your objectives, or your financial situation. We aim to bring you long-term focused analysis driven by fundamental data. Note that our analysis may not factor in the latest price-sensitive company announcements or qualitative material. Simply Wall St has no position in any stocks mentioned.
Join A Paid User Research Session
You’ll receive a US$30 Amazon Gift card for 1 hour of your time while helping us build better investing tools for the individual investors like yourself. Sign up here
