
 Yahoo Finance
 Shareholders in ASA International Group (LON:ASAI) are in the red if they invested five years ago
Some stocks are best avoided. We really hate to see fellow investors lose their hard-earned money. Imagine if you held ASA International Group PLC (LON:ASAI) for half a decade as the share price tanked 89%. And some of the more recent buyers are probably worried, too, with the stock falling 45% in the last year. Unfortunately the share price momentum is still quite negative, with prices down 16% in thirty days. While a drop like that is definitely a body blow, money isn't as important as health and happiness.
It's worthwhile assessing if the company's economics have been moving in lockstep with these underwhelming shareholder returns, or if there is some disparity between the two. So let's do just that.
View our latest analysis for ASA International Group
To paraphrase Benjamin Graham: Over the short term the market is a voting machine, but over the long term it's a weighing machine. One flawed but reasonable way to assess how sentiment around a company has changed is to compare the earnings per share (EPS) with the share price.
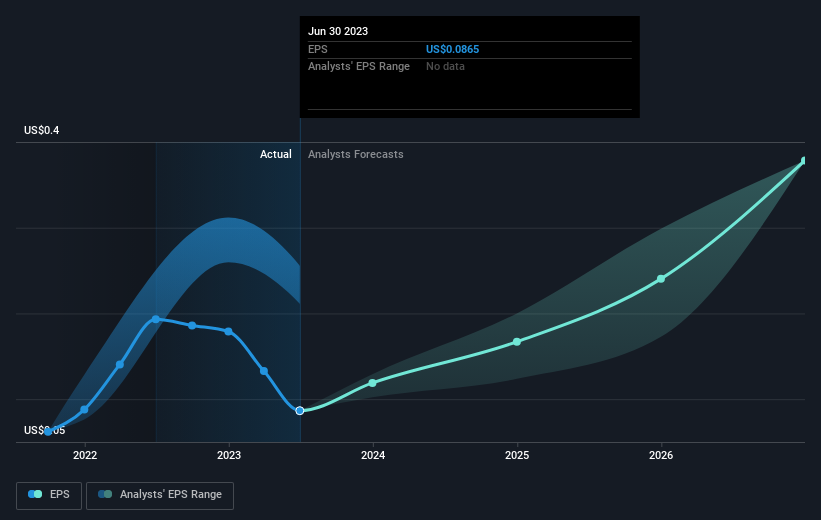
Looking back five years, both ASA International Group's share price and EPS declined; the latter at a rate of 58% per year. The share price decline of 35% per year isn't as bad as the EPS decline. So the market may previously have expected a drop, or else it expects the situation will improve.
The image below shows how EPS has tracked over time (if you click on the image you can see greater detail).
It's probably worth noting that the CEO is paid less than the median at similar sized companies. But while CEO remuneration is always worth checking, the really important question is whether the company can grow earnings going forward. It might be well worthwhile taking a look at our free report on ASA International Group's earnings, revenue and cash flow.
A Different Perspective
While the broader market lost about 0.2% in the twelve months, ASA International Group shareholders did even worse, losing 45%. Having said that, it's inevitable that some stocks will be oversold in a falling market. The key is to keep your eyes on the fundamental developments. Unfortunately, last year's performance may indicate unresolved challenges, given that it was worse than the annualised loss of 13% over the last half decade. Generally speaking long term share price weakness can be a bad sign, though contrarian investors might want to research the stock in hope of a turnaround. I find it very interesting to look at share price over the long term as a proxy for business performance. But to truly gain insight, we need to consider other information, too. For example, we've discovered 3 warning signs for ASA International Group (1 is concerning!) that you should be aware of before investing here.
But note: ASA International Group may not be the best stock to buy. So take a peek at this free list of interesting companies with past earnings growth (and further growth forecast).
Please note, the market returns quoted in this article reflect the market weighted average returns of stocks that currently trade on British exchanges.
Have feedback on this article? Concerned about the content? Get in touch with us directly. Alternatively, email editorial-team (at) simplywallst.com.
This article by Simply Wall St is general in nature. We provide commentary based on historical data and analyst forecasts only using an unbiased methodology and our articles are not intended to be financial advice. It does not constitute a recommendation to buy or sell any stock, and does not take account of your objectives, or your financial situation. We aim to bring you long-term focused analysis driven by fundamental data. Note that our analysis may not factor in the latest price-sensitive company announcements or qualitative material. Simply Wall St has no position in any stocks mentioned.
