
 Yahoo Finance
 Shareholders in Carr's Group (LON:CARR) are in the red if they invested five years ago
Carr's Group plc (LON:CARR) shareholders should be happy to see the share price up 24% in the last month. But if you look at the last five years the returns have not been good. In fact, the share price is down 26%, which falls well short of the return you could get by buying an index fund.
It's worthwhile assessing if the company's economics have been moving in lockstep with these underwhelming shareholder returns, or if there is some disparity between the two. So let's do just that.
View our latest analysis for Carr's Group
We don't think that Carr's Group's modest trailing twelve month profit has the market's full attention at the moment. We think revenue is probably a better guide. Generally speaking, we'd consider a stock like this alongside loss-making companies, simply because the quantum of the profit is so low. It would be hard to believe in a more profitable future without growing revenues.
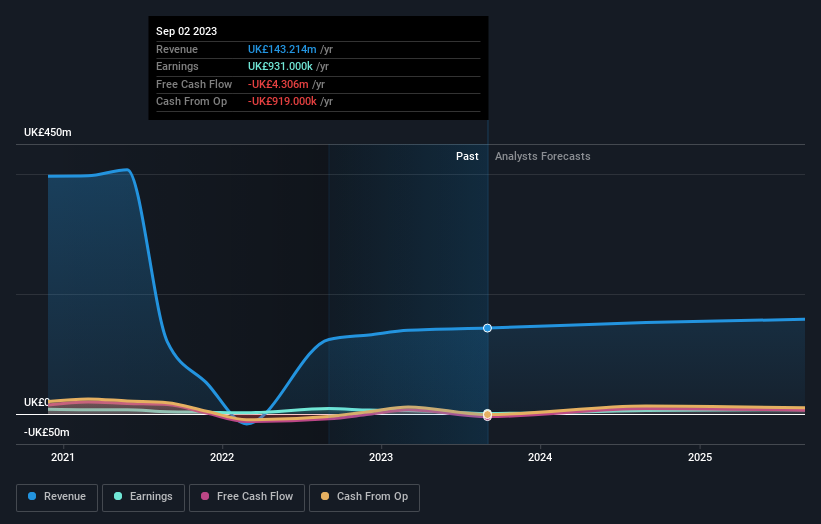
In the last five years Carr's Group saw its revenue shrink by 28% per year. That's definitely a weaker result than most pre-profit companies report. On the face of it we'd posit the share price fall of 5% compound, over five years is well justified by the fundamental deterioration. We doubt many shareholders are delighted with this share price performance. Risk averse investors probably wouldn't like this one much.
The image below shows how earnings and revenue have tracked over time (if you click on the image you can see greater detail).
We consider it positive that insiders have made significant purchases in the last year. Even so, future earnings will be far more important to whether current shareholders make money. So we recommend checking out this free report showing consensus forecasts
What About Dividends?
As well as measuring the share price return, investors should also consider the total shareholder return (TSR). The TSR incorporates the value of any spin-offs or discounted capital raisings, along with any dividends, based on the assumption that the dividends are reinvested. It's fair to say that the TSR gives a more complete picture for stocks that pay a dividend. We note that for Carr's Group the TSR over the last 5 years was -11%, which is better than the share price return mentioned above. And there's no prize for guessing that the dividend payments largely explain the divergence!
A Different Perspective
It's nice to see that Carr's Group shareholders have received a total shareholder return of 9.5% over the last year. And that does include the dividend. That certainly beats the loss of about 2% per year over the last half decade. This makes us a little wary, but the business might have turned around its fortunes. It's always interesting to track share price performance over the longer term. But to understand Carr's Group better, we need to consider many other factors. For example, we've discovered 2 warning signs for Carr's Group (1 makes us a bit uncomfortable!) that you should be aware of before investing here.
Carr's Group is not the only stock insiders are buying. So take a peek at this free list of growing companies with insider buying.
Please note, the market returns quoted in this article reflect the market weighted average returns of stocks that currently trade on British exchanges.
Have feedback on this article? Concerned about the content? Get in touch with us directly. Alternatively, email editorial-team (at) simplywallst.com.
This article by Simply Wall St is general in nature. We provide commentary based on historical data and analyst forecasts only using an unbiased methodology and our articles are not intended to be financial advice. It does not constitute a recommendation to buy or sell any stock, and does not take account of your objectives, or your financial situation. We aim to bring you long-term focused analysis driven by fundamental data. Note that our analysis may not factor in the latest price-sensitive company announcements or qualitative material. Simply Wall St has no position in any stocks mentioned.
