
 Yahoo Finance
 Shareholders in Compass Minerals International (NYSE:CMP) have lost 76%, as stock drops 9.4% this past week
Every investor on earth makes bad calls sometimes. But really big losses can really drag down an overall portfolio. So spare a thought for the long term shareholders of Compass Minerals International, Inc. (NYSE:CMP); the share price is down a whopping 78% in the last three years. That'd be enough to cause even the strongest minds some disquiet. The more recent news is of little comfort, with the share price down 55% in a year. The falls have accelerated recently, with the share price down 35% in the last three months.
Given the past week has been tough on shareholders, let's investigate the fundamentals and see what we can learn.
View our latest analysis for Compass Minerals International
To paraphrase Benjamin Graham: Over the short term the market is a voting machine, but over the long term it's a weighing machine. One way to examine how market sentiment has changed over time is to look at the interaction between a company's share price and its earnings per share (EPS).
Compass Minerals International has made a profit in the past. On the other hand, it reported a trailing twelve months loss, suggesting it isn't reliably profitable. Other metrics might give us a better handle on how its value is changing over time.
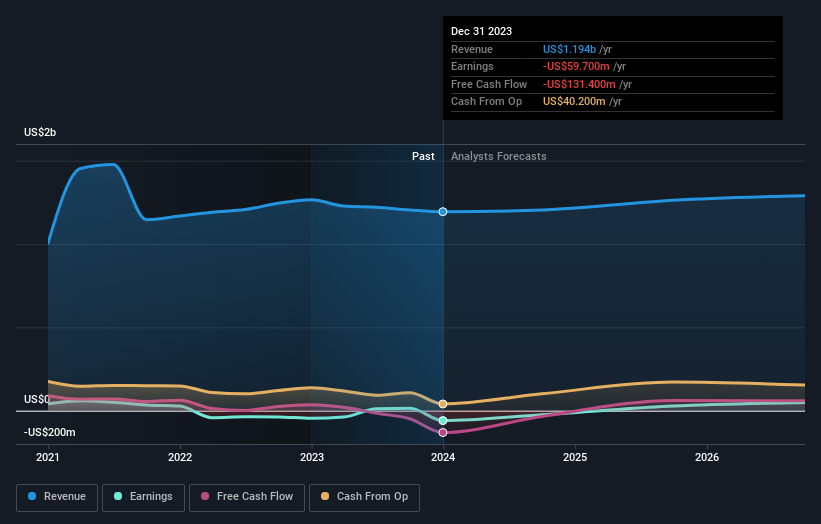
It's quite likely that the declining dividend has caused some investors to sell their shares, pushing the price lower in the process. It doesn't seem like the changes in revenue would have impacted the share price much, but a closer inspection of the data might reveal something.
You can see how earnings and revenue have changed over time in the image below (click on the chart to see the exact values).
It's good to see that there was some significant insider buying in the last three months. That's a positive. That said, we think earnings and revenue growth trends are even more important factors to consider. If you are thinking of buying or selling Compass Minerals International stock, you should check out this free report showing analyst profit forecasts.
A Different Perspective
Compass Minerals International shareholders are down 54% for the year (even including dividends), but the market itself is up 28%. However, keep in mind that even the best stocks will sometimes underperform the market over a twelve month period. Regrettably, last year's performance caps off a bad run, with the shareholders facing a total loss of 11% per year over five years. Generally speaking long term share price weakness can be a bad sign, though contrarian investors might want to research the stock in hope of a turnaround. It's always interesting to track share price performance over the longer term. But to understand Compass Minerals International better, we need to consider many other factors. For example, we've discovered 2 warning signs for Compass Minerals International that you should be aware of before investing here.
Compass Minerals International is not the only stock that insiders are buying. For those who like to find winning investments this free list of growing companies with recent insider purchasing, could be just the ticket.
Please note, the market returns quoted in this article reflect the market weighted average returns of stocks that currently trade on American exchanges.
Have feedback on this article? Concerned about the content? Get in touch with us directly. Alternatively, email editorial-team (at) simplywallst.com.
This article by Simply Wall St is general in nature. We provide commentary based on historical data and analyst forecasts only using an unbiased methodology and our articles are not intended to be financial advice. It does not constitute a recommendation to buy or sell any stock, and does not take account of your objectives, or your financial situation. We aim to bring you long-term focused analysis driven by fundamental data. Note that our analysis may not factor in the latest price-sensitive company announcements or qualitative material. Simply Wall St has no position in any stocks mentioned.
