
 Yahoo Finance
 Shareholders in Dignity (LON:DTY) are in the red if they invested five years ago
Dignity plc (LON:DTY) shareholders should be happy to see the share price up 25% in the last month. But that doesn't change the fact that the returns over the last half decade have been stomach churning. Indeed, the share price is down a whopping 79% in that time. So we don't gain too much confidence from the recent recovery. The important question is if the business itself justifies a higher share price in the long term.
Now let's have a look at the company's fundamentals, and see if the long term shareholder return has matched the performance of the underlying business.
View our latest analysis for Dignity
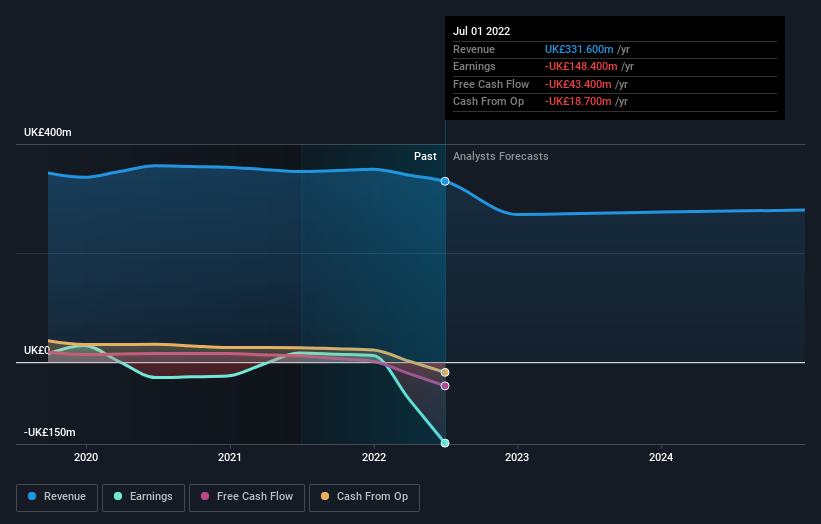
Given that Dignity didn't make a profit in the last twelve months, we'll focus on revenue growth to form a quick view of its business development. When a company doesn't make profits, we'd generally expect to see good revenue growth. That's because fast revenue growth can be easily extrapolated to forecast profits, often of considerable size.
Over five years, Dignity grew its revenue at 1.3% per year. That's not a very high growth rate considering it doesn't make profits. Nonetheless, it's fair to say the rapidly declining share price (down 12%, compound, over five years) suggests the market is very disappointed with this level of growth. While we're definitely wary of the stock, after that kind of performance, it could be an over-reaction. We'd recommend focussing any further research on the likelihood of profitability in the foreseeable future, given the muted revenue growth.
The image below shows how earnings and revenue have tracked over time (if you click on the image you can see greater detail).
If you are thinking of buying or selling Dignity stock, you should check out this FREE detailed report on its balance sheet.
A Different Perspective
While the broader market lost about 8.9% in the twelve months, Dignity shareholders did even worse, losing 37%. However, it could simply be that the share price has been impacted by broader market jitters. It might be worth keeping an eye on the fundamentals, in case there's a good opportunity. Unfortunately, last year's performance may indicate unresolved challenges, given that it was worse than the annualised loss of 12% over the last half decade. Generally speaking long term share price weakness can be a bad sign, though contrarian investors might want to research the stock in hope of a turnaround. While it is well worth considering the different impacts that market conditions can have on the share price, there are other factors that are even more important. For instance, we've identified 4 warning signs for Dignity (3 are potentially serious) that you should be aware of.
For those who like to find winning investments this free list of growing companies with recent insider purchasing, could be just the ticket.
Please note, the market returns quoted in this article reflect the market weighted average returns of stocks that currently trade on GB exchanges.
Have feedback on this article? Concerned about the content? Get in touch with us directly. Alternatively, email editorial-team (at) simplywallst.com.
This article by Simply Wall St is general in nature. We provide commentary based on historical data and analyst forecasts only using an unbiased methodology and our articles are not intended to be financial advice. It does not constitute a recommendation to buy or sell any stock, and does not take account of your objectives, or your financial situation. We aim to bring you long-term focused analysis driven by fundamental data. Note that our analysis may not factor in the latest price-sensitive company announcements or qualitative material. Simply Wall St has no position in any stocks mentioned.
Join A Paid User Research Session
You’ll receive a US$30 Amazon Gift card for 1 hour of your time while helping us build better investing tools for the individual investors like yourself. Sign up here
