
 Yahoo Finance
 Shareholders in DXC Technology (NYSE:DXC) are in the red if they invested five years ago
Generally speaking long term investing is the way to go. But unfortunately, some companies simply don't succeed. For example the DXC Technology Company (NYSE:DXC) share price dropped 72% over five years. That's not a lot of fun for true believers.
With that in mind, it's worth seeing if the company's underlying fundamentals have been the driver of long term performance, or if there are some discrepancies.
View our latest analysis for DXC Technology
To quote Buffett, 'Ships will sail around the world but the Flat Earth Society will flourish. There will continue to be wide discrepancies between price and value in the marketplace...' One imperfect but simple way to consider how the market perception of a company has shifted is to compare the change in the earnings per share (EPS) with the share price movement.
During five years of share price growth, DXC Technology moved from a loss to profitability. Most would consider that to be a good thing, so it's counter-intuitive to see the share price declining. Other metrics might give us a better handle on how its value is changing over time.
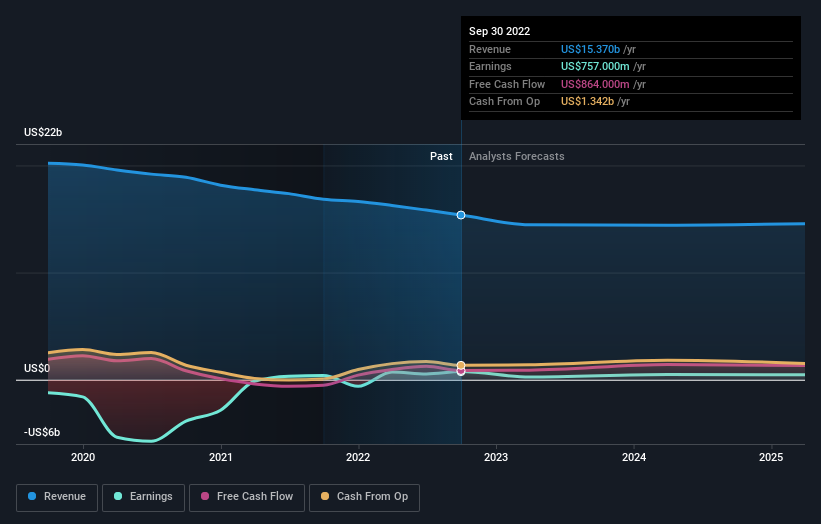
It could be that the revenue decline of 4.4% per year is viewed as evidence that DXC Technology is shrinking. This has probably encouraged some shareholders to sell down the stock.
The company's revenue and earnings (over time) are depicted in the image below (click to see the exact numbers).
DXC Technology is well known by investors, and plenty of clever analysts have tried to predict the future profit levels. If you are thinking of buying or selling DXC Technology stock, you should check out this free report showing analyst consensus estimates for future profits.
What About The Total Shareholder Return (TSR)?
We'd be remiss not to mention the difference between DXC Technology's total shareholder return (TSR) and its share price return. Arguably the TSR is a more complete return calculation because it accounts for the value of dividends (as if they were reinvested), along with the hypothetical value of any discounted capital that have been offered to shareholders. Dividends have been really beneficial for DXC Technology shareholders, and that cash payout explains why its total shareholder loss of 66%, over the last 5 years, isn't as bad as the share price return.
A Different Perspective
While it's certainly disappointing to see that DXC Technology shares lost 6.3% throughout the year, that wasn't as bad as the market loss of 10%. Of far more concern is the 11% p.a. loss served to shareholders over the last five years. This sort of share price action isn't particularly encouraging, but at least the losses are slowing. While it is well worth considering the different impacts that market conditions can have on the share price, there are other factors that are even more important. For example, we've discovered 1 warning sign for DXC Technology that you should be aware of before investing here.
If you like to buy stocks alongside management, then you might just love this free list of companies. (Hint: insiders have been buying them).
Please note, the market returns quoted in this article reflect the market weighted average returns of stocks that currently trade on US exchanges.
Have feedback on this article? Concerned about the content? Get in touch with us directly. Alternatively, email editorial-team (at) simplywallst.com.
This article by Simply Wall St is general in nature. We provide commentary based on historical data and analyst forecasts only using an unbiased methodology and our articles are not intended to be financial advice. It does not constitute a recommendation to buy or sell any stock, and does not take account of your objectives, or your financial situation. We aim to bring you long-term focused analysis driven by fundamental data. Note that our analysis may not factor in the latest price-sensitive company announcements or qualitative material. Simply Wall St has no position in any stocks mentioned.
Join A Paid User Research Session
You’ll receive a US$30 Amazon Gift card for 1 hour of your time while helping us build better investing tools for the individual investors like yourself. Sign up here
