
 Yahoo Finance
 Some Shareholders Feeling Restless Over Ambarella, Inc.'s (NASDAQ:AMBA) P/S Ratio
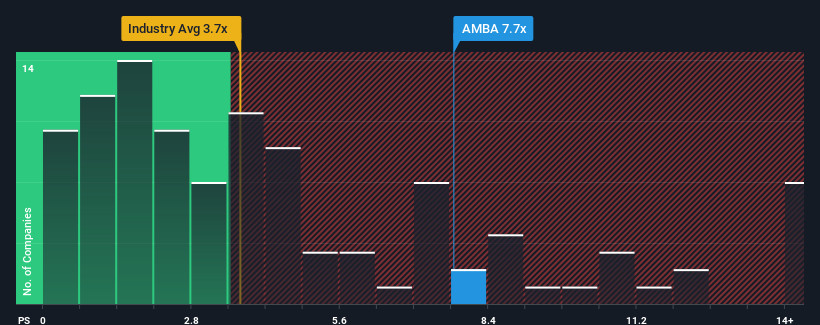
With a price-to-sales (or "P/S") ratio of 7.7x Ambarella, Inc. (NASDAQ:AMBA) may be sending very bearish signals at the moment, given that almost half of all the Semiconductor companies in the United States have P/S ratios under 3.7x and even P/S lower than 1.7x are not unusual. Nonetheless, we'd need to dig a little deeper to determine if there is a rational basis for the highly elevated P/S.
See our latest analysis for Ambarella
How Ambarella Has Been Performing
Recent times haven't been great for Ambarella as its revenue has been rising slower than most other companies. It might be that many expect the uninspiring revenue performance to recover significantly, which has kept the P/S ratio from collapsing. You'd really hope so, otherwise you're paying a pretty hefty price for no particular reason.
Keen to find out how analysts think Ambarella's future stacks up against the industry? In that case, our free report is a great place to start.
Is There Enough Revenue Growth Forecasted For Ambarella?
In order to justify its P/S ratio, Ambarella would need to produce outstanding growth that's well in excess of the industry.
If we review the last year of revenue, the company posted a result that saw barely any deviation from a year ago. Although pleasingly revenue has lifted 48% in aggregate from three years ago, notwithstanding the last 12 months. Accordingly, shareholders will be pleased, but also have some questions to ponder about the last 12 months.
Turning to the outlook, the next three years should generate growth of 13% per year as estimated by the analysts watching the company. Meanwhile, the rest of the industry is forecast to expand by 11% per annum, which is not materially different.
With this in consideration, we find it intriguing that Ambarella's P/S is higher than its industry peers. It seems most investors are ignoring the fairly average growth expectations and are willing to pay up for exposure to the stock. Although, additional gains will be difficult to achieve as this level of revenue growth is likely to weigh down the share price eventually.
What We Can Learn From Ambarella's P/S?
Using the price-to-sales ratio alone to determine if you should sell your stock isn't sensible, however it can be a practical guide to the company's future prospects.
Analysts are forecasting Ambarella's revenues to only grow on par with the rest of the industry, which has lead to the high P/S ratio being unexpected. Right now we are uncomfortable with the relatively high share price as the predicted future revenues aren't likely to support such positive sentiment for long. A positive change is needed in order to justify the current price-to-sales ratio.
There are also other vital risk factors to consider before investing and we've discovered 3 warning signs for Ambarella that you should be aware of.
If you're unsure about the strength of Ambarella's business, why not explore our interactive list of stocks with solid business fundamentals for some other companies you may have missed.
Have feedback on this article? Concerned about the content? Get in touch with us directly. Alternatively, email editorial-team (at) simplywallst.com.
This article by Simply Wall St is general in nature. We provide commentary based on historical data and analyst forecasts only using an unbiased methodology and our articles are not intended to be financial advice. It does not constitute a recommendation to buy or sell any stock, and does not take account of your objectives, or your financial situation. We aim to bring you long-term focused analysis driven by fundamental data. Note that our analysis may not factor in the latest price-sensitive company announcements or qualitative material. Simply Wall St has no position in any stocks mentioned.
Join A Paid User Research Session
You’ll receive a US$30 Amazon Gift card for 1 hour of your time while helping us build better investing tools for the individual investors like yourself. Sign up here
