
 Yahoo Finance
 Some Shareholders Feeling Restless Over Stock3 AG's (ETR:BOG) P/E Ratio
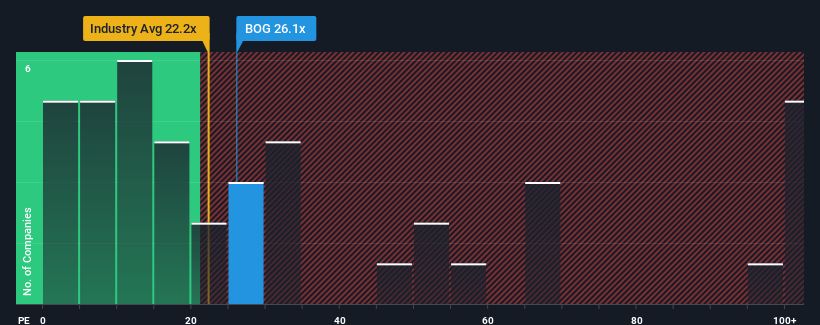
Stock3 AG's (ETR:BOG) price-to-earnings (or "P/E") ratio of 26.1x might make it look like a strong sell right now compared to the market in Germany, where around half of the companies have P/E ratios below 15x and even P/E's below 9x are quite common. Although, it's not wise to just take the P/E at face value as there may be an explanation why it's so lofty.
For instance, Stock3's receding earnings in recent times would have to be some food for thought. One possibility is that the P/E is high because investors think the company will still do enough to outperform the broader market in the near future. You'd really hope so, otherwise you're paying a pretty hefty price for no particular reason.
Check out our latest analysis for Stock3
Want the full picture on earnings, revenue and cash flow for the company? Then our free report on Stock3 will help you shine a light on its historical performance.
Does Growth Match The High P/E?
There's an inherent assumption that a company should far outperform the market for P/E ratios like Stock3's to be considered reasonable.
Taking a look back first, the company's earnings per share growth last year wasn't something to get excited about as it posted a disappointing decline of 27%. This has erased any of its gains during the last three years, with practically no change in EPS being achieved in total. Therefore, it's fair to say that earnings growth has been inconsistent recently for the company.
Comparing that to the market, which is predicted to deliver 13% growth in the next 12 months, the company's momentum is weaker based on recent medium-term annualised earnings results.
In light of this, it's alarming that Stock3's P/E sits above the majority of other companies. It seems most investors are ignoring the fairly limited recent growth rates and are hoping for a turnaround in the company's business prospects. There's a good chance existing shareholders are setting themselves up for future disappointment if the P/E falls to levels more in line with recent growth rates.
The Final Word
It's argued the price-to-earnings ratio is an inferior measure of value within certain industries, but it can be a powerful business sentiment indicator.
Our examination of Stock3 revealed its three-year earnings trends aren't impacting its high P/E anywhere near as much as we would have predicted, given they look worse than current market expectations. Right now we are increasingly uncomfortable with the high P/E as this earnings performance isn't likely to support such positive sentiment for long. Unless the recent medium-term conditions improve markedly, it's very challenging to accept these prices as being reasonable.
Plus, you should also learn about this 1 warning sign we've spotted with Stock3.
It's important to make sure you look for a great company, not just the first idea you come across. So take a peek at this free list of interesting companies with strong recent earnings growth (and a low P/E).
Have feedback on this article? Concerned about the content? Get in touch with us directly. Alternatively, email editorial-team (at) simplywallst.com.
This article by Simply Wall St is general in nature. We provide commentary based on historical data and analyst forecasts only using an unbiased methodology and our articles are not intended to be financial advice. It does not constitute a recommendation to buy or sell any stock, and does not take account of your objectives, or your financial situation. We aim to bring you long-term focused analysis driven by fundamental data. Note that our analysis may not factor in the latest price-sensitive company announcements or qualitative material. Simply Wall St has no position in any stocks mentioned.
