
 Yahoo Finance
 Shareholders in UP Fintech Holding (NASDAQ:TIGR) are in the red if they invested a year ago
As every investor would know, you don't hit a homerun every time you swing. But it should be a priority to avoid stomach churning catastrophes, wherever possible. So spare a thought for the long term shareholders of UP Fintech Holding Limited (NASDAQ:TIGR); the share price is down a whopping 78% in the last twelve months. That'd be a striking reminder about the importance of diversification. To make matters worse, the returns over three years have also been really disappointing (the share price is 56% lower than three years ago). More recently, the share price has dropped a further 24% in a month. Importantly, this could be a market reaction to the recently released financial results. You can check out the latest numbers in our company report.
Since shareholders are down over the longer term, lets look at the underlying fundamentals over the that time and see if they've been consistent with returns.
Check out our latest analysis for UP Fintech Holding
While the efficient markets hypothesis continues to be taught by some, it has been proven that markets are over-reactive dynamic systems, and investors are not always rational. One way to examine how market sentiment has changed over time is to look at the interaction between a company's share price and its earnings per share (EPS).
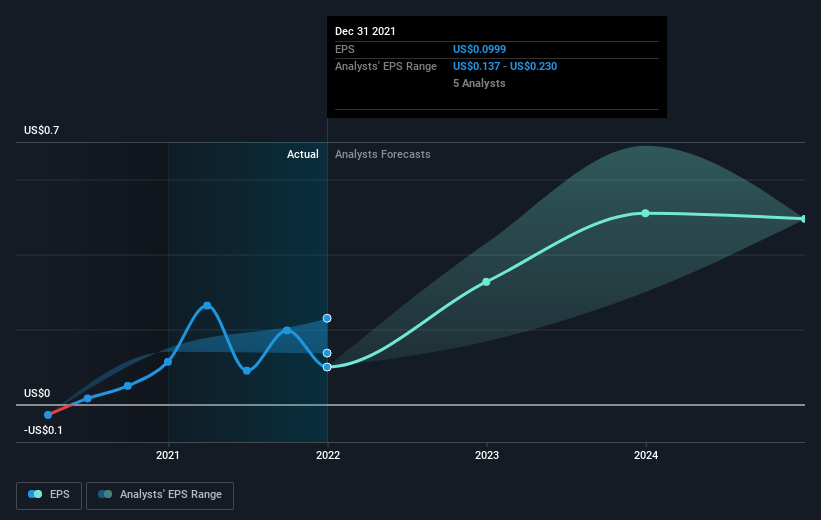
Unfortunately UP Fintech Holding reported an EPS drop of 12% for the last year. This reduction in EPS is not as bad as the 78% share price fall. Unsurprisingly, given the lack of EPS growth, the market seems to be more cautious about the stock.
The image below shows how EPS has tracked over time (if you click on the image you can see greater detail).
We know that UP Fintech Holding has improved its bottom line over the last three years, but what does the future have in store? This free interactive report on UP Fintech Holding's balance sheet strength is a great place to start, if you want to investigate the stock further.
A Different Perspective
The last twelve months weren't great for UP Fintech Holding shares, which performed worse than the market, costing holders 78%. The market shed around 8.4%, no doubt weighing on the stock price. Shareholders have lost 16% per year over the last three years, so the share price drop has become steeper, over the last year; a potential symptom of as yet unsolved challenges. Although Baron Rothschild famously said to "buy when there's blood in the streets, even if the blood is your own", he also focusses on high quality stocks with solid prospects. While it is well worth considering the different impacts that market conditions can have on the share price, there are other factors that are even more important. Consider for instance, the ever-present spectre of investment risk. We've identified 4 warning signs with UP Fintech Holding , and understanding them should be part of your investment process.
But note: UP Fintech Holding may not be the best stock to buy. So take a peek at this free list of interesting companies with past earnings growth (and further growth forecast).
Please note, the market returns quoted in this article reflect the market weighted average returns of stocks that currently trade on US exchanges.
Have feedback on this article? Concerned about the content? Get in touch with us directly. Alternatively, email editorial-team (at) simplywallst.com.
This article by Simply Wall St is general in nature. We provide commentary based on historical data and analyst forecasts only using an unbiased methodology and our articles are not intended to be financial advice. It does not constitute a recommendation to buy or sell any stock, and does not take account of your objectives, or your financial situation. We aim to bring you long-term focused analysis driven by fundamental data. Note that our analysis may not factor in the latest price-sensitive company announcements or qualitative material. Simply Wall St has no position in any stocks mentioned.
